> ## Documentation Index
> Fetch the complete documentation index at: https://docs.runway.com/llms.txt
> Use this file to discover all available pages before exploring further.
# Drivers table block
> Driver table blocks add model drivers to pages as editable tables for reporting, planning, and review.
Driver table blocks let you bring drivers from across Runway onto a page. Use them when you want a page to show driver values, formulas, rollups, scenario comparisons, or editable planning inputs in table form.
## Creating a driver table block
On a page, type **/** to access block options.
Select **Driver table**.
Choose the drivers you want to include. You can add or remove drivers later.
## Customizing table columns
When you first add a driver table block, it displays the driver name and data by default. You can choose which columns appear.
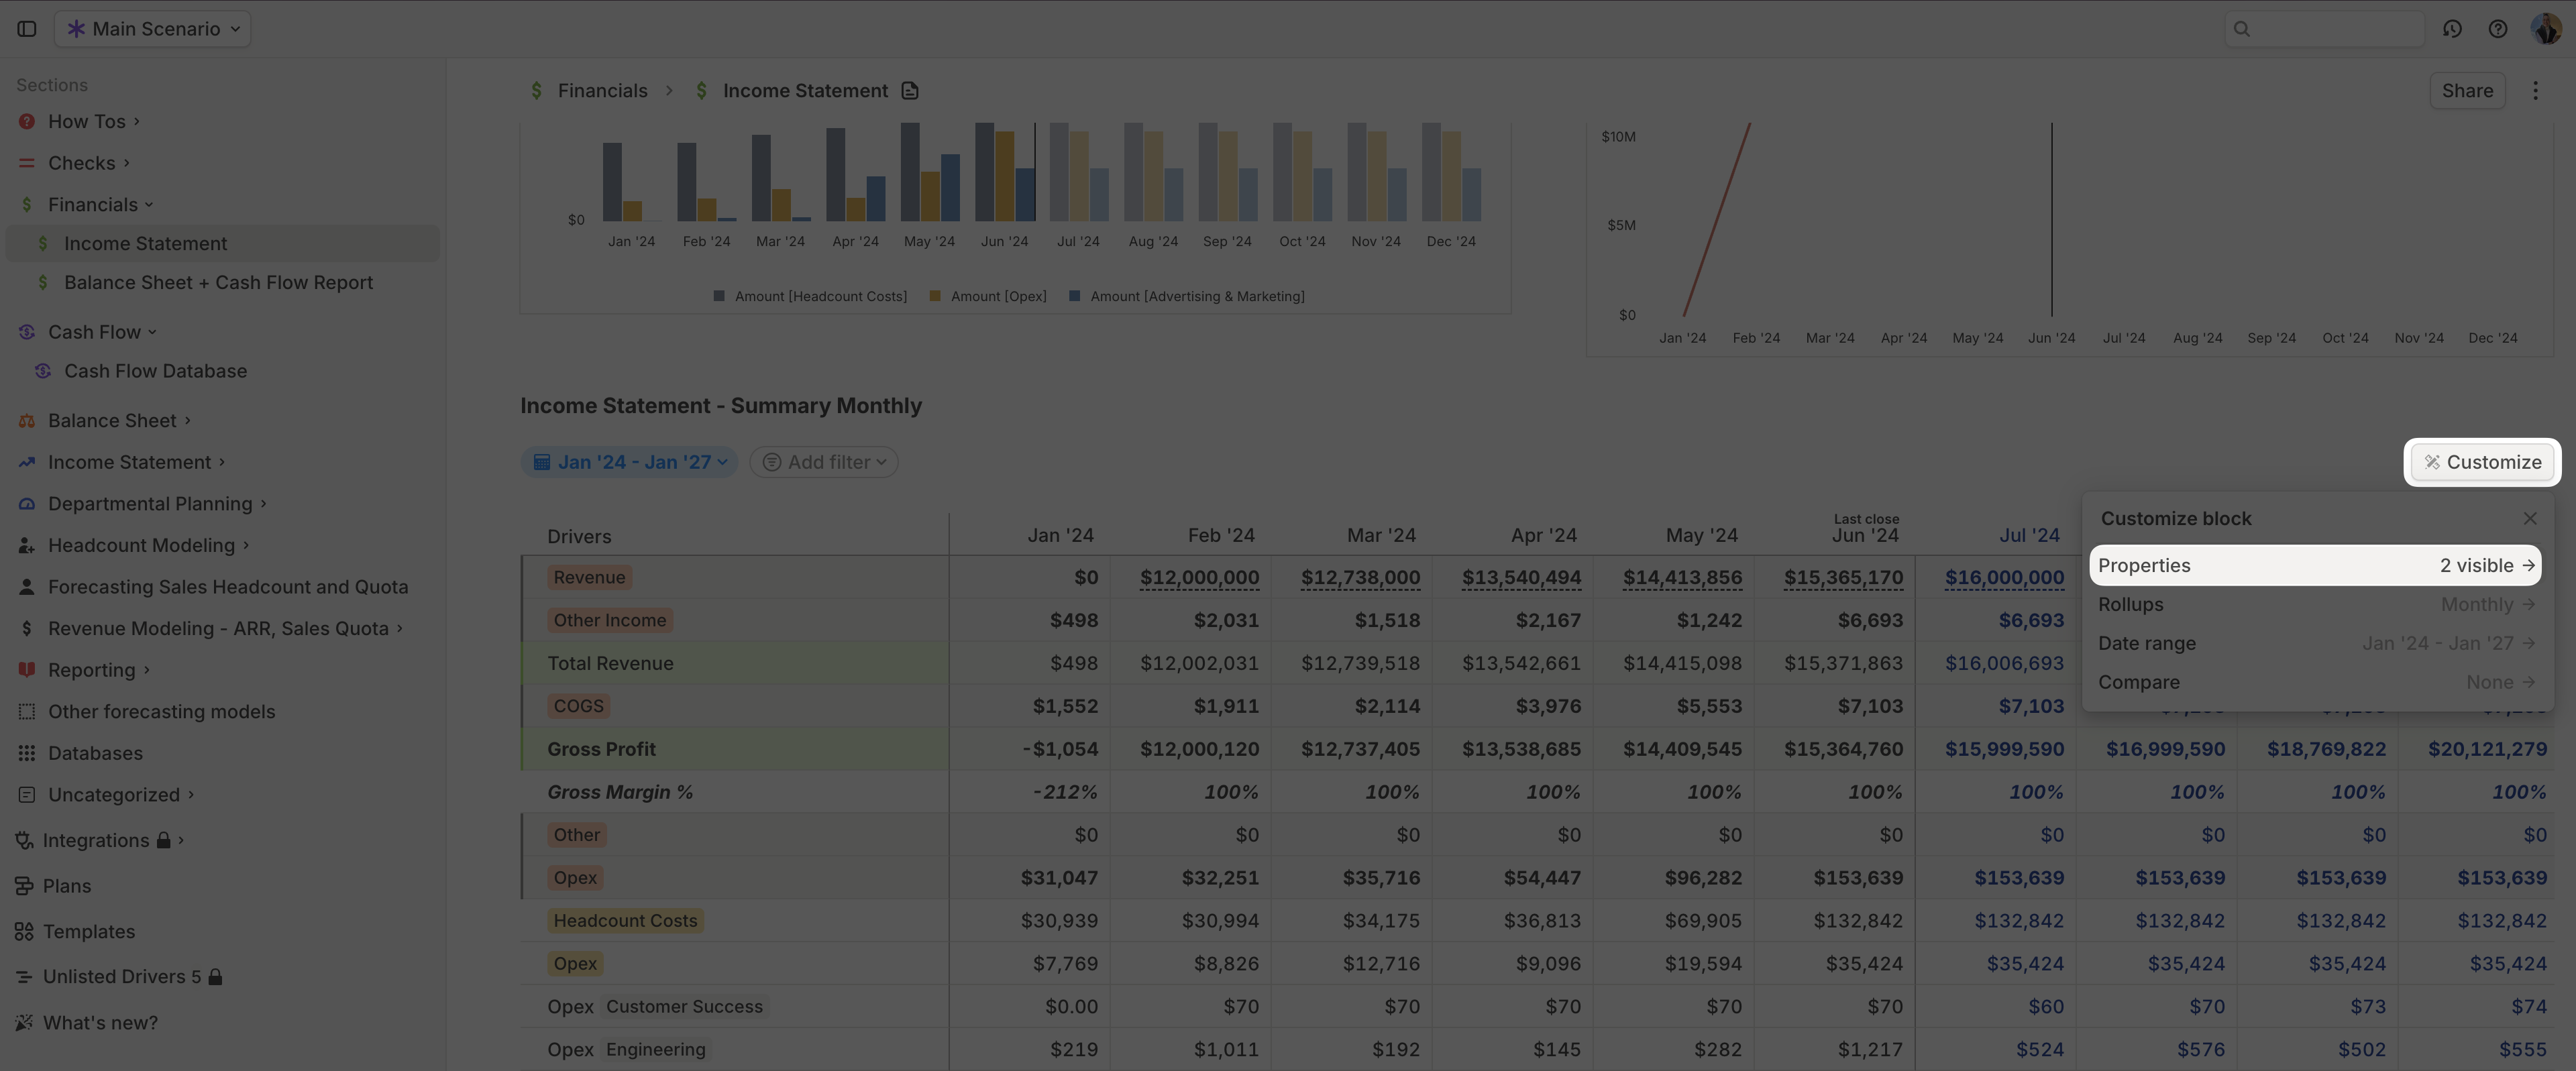
Click **Customize** in the top-right corner of the block.
Select **Properties**.
Show or hide columns such as **Data**, **Actuals Formula**, **Forecast Formula**, **Used By**, **Graph**, and **Rollup**.
 ## Viewing formulas in the table
Driver table blocks can show formula columns alongside values.
Click **Customize** in the top-right corner of the block.
Select **Properties**.
Enable **Actuals Formula** or **Forecast Formula**.
Use the formula toolbar button labeled **Open formulas** to show formula columns while you work. When formula columns are visible, the button changes to **Hide formulas**. You can also toggle **Actuals Formula** with `⌥⇧A` on Mac or `Alt+Shift+A` on Windows, toggle **Forecast Formula** with `⌥⇧F` on Mac or `Alt+Shift+F` on Windows, and toggle pinned formula columns with `⌘⌥P` on Mac or `Ctrl+Alt+P` on Windows.
## Managing drivers in the table
Use **+ Add driver** to add existing drivers or create a new driver directly in the block.
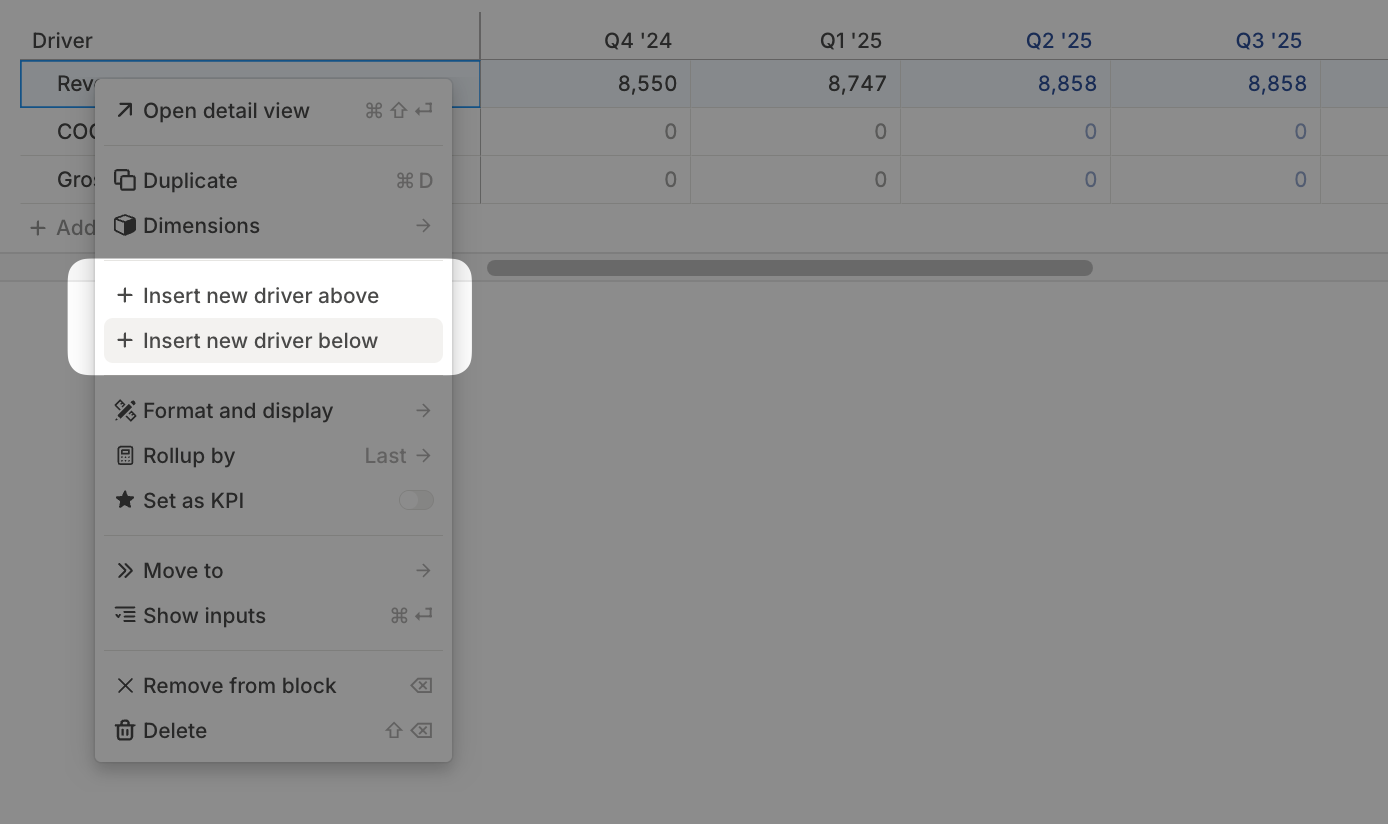
To insert a driver near another driver, right-click a driver name or open its left-side menu, then select **+ Insert new driver above** or **+ Insert new driver below**. The shortcuts reference lists the keyboard shortcuts for inserting rows.
## Viewing formulas in the table
Driver table blocks can show formula columns alongside values.
Click **Customize** in the top-right corner of the block.
Select **Properties**.
Enable **Actuals Formula** or **Forecast Formula**.
Use the formula toolbar button labeled **Open formulas** to show formula columns while you work. When formula columns are visible, the button changes to **Hide formulas**. You can also toggle **Actuals Formula** with `⌥⇧A` on Mac or `Alt+Shift+A` on Windows, toggle **Forecast Formula** with `⌥⇧F` on Mac or `Alt+Shift+F` on Windows, and toggle pinned formula columns with `⌘⌥P` on Mac or `Ctrl+Alt+P` on Windows.
## Managing drivers in the table
Use **+ Add driver** to add existing drivers or create a new driver directly in the block.
To insert a driver near another driver, right-click a driver name or open its left-side menu, then select **+ Insert new driver above** or **+ Insert new driver below**. The shortcuts reference lists the keyboard shortcuts for inserting rows.
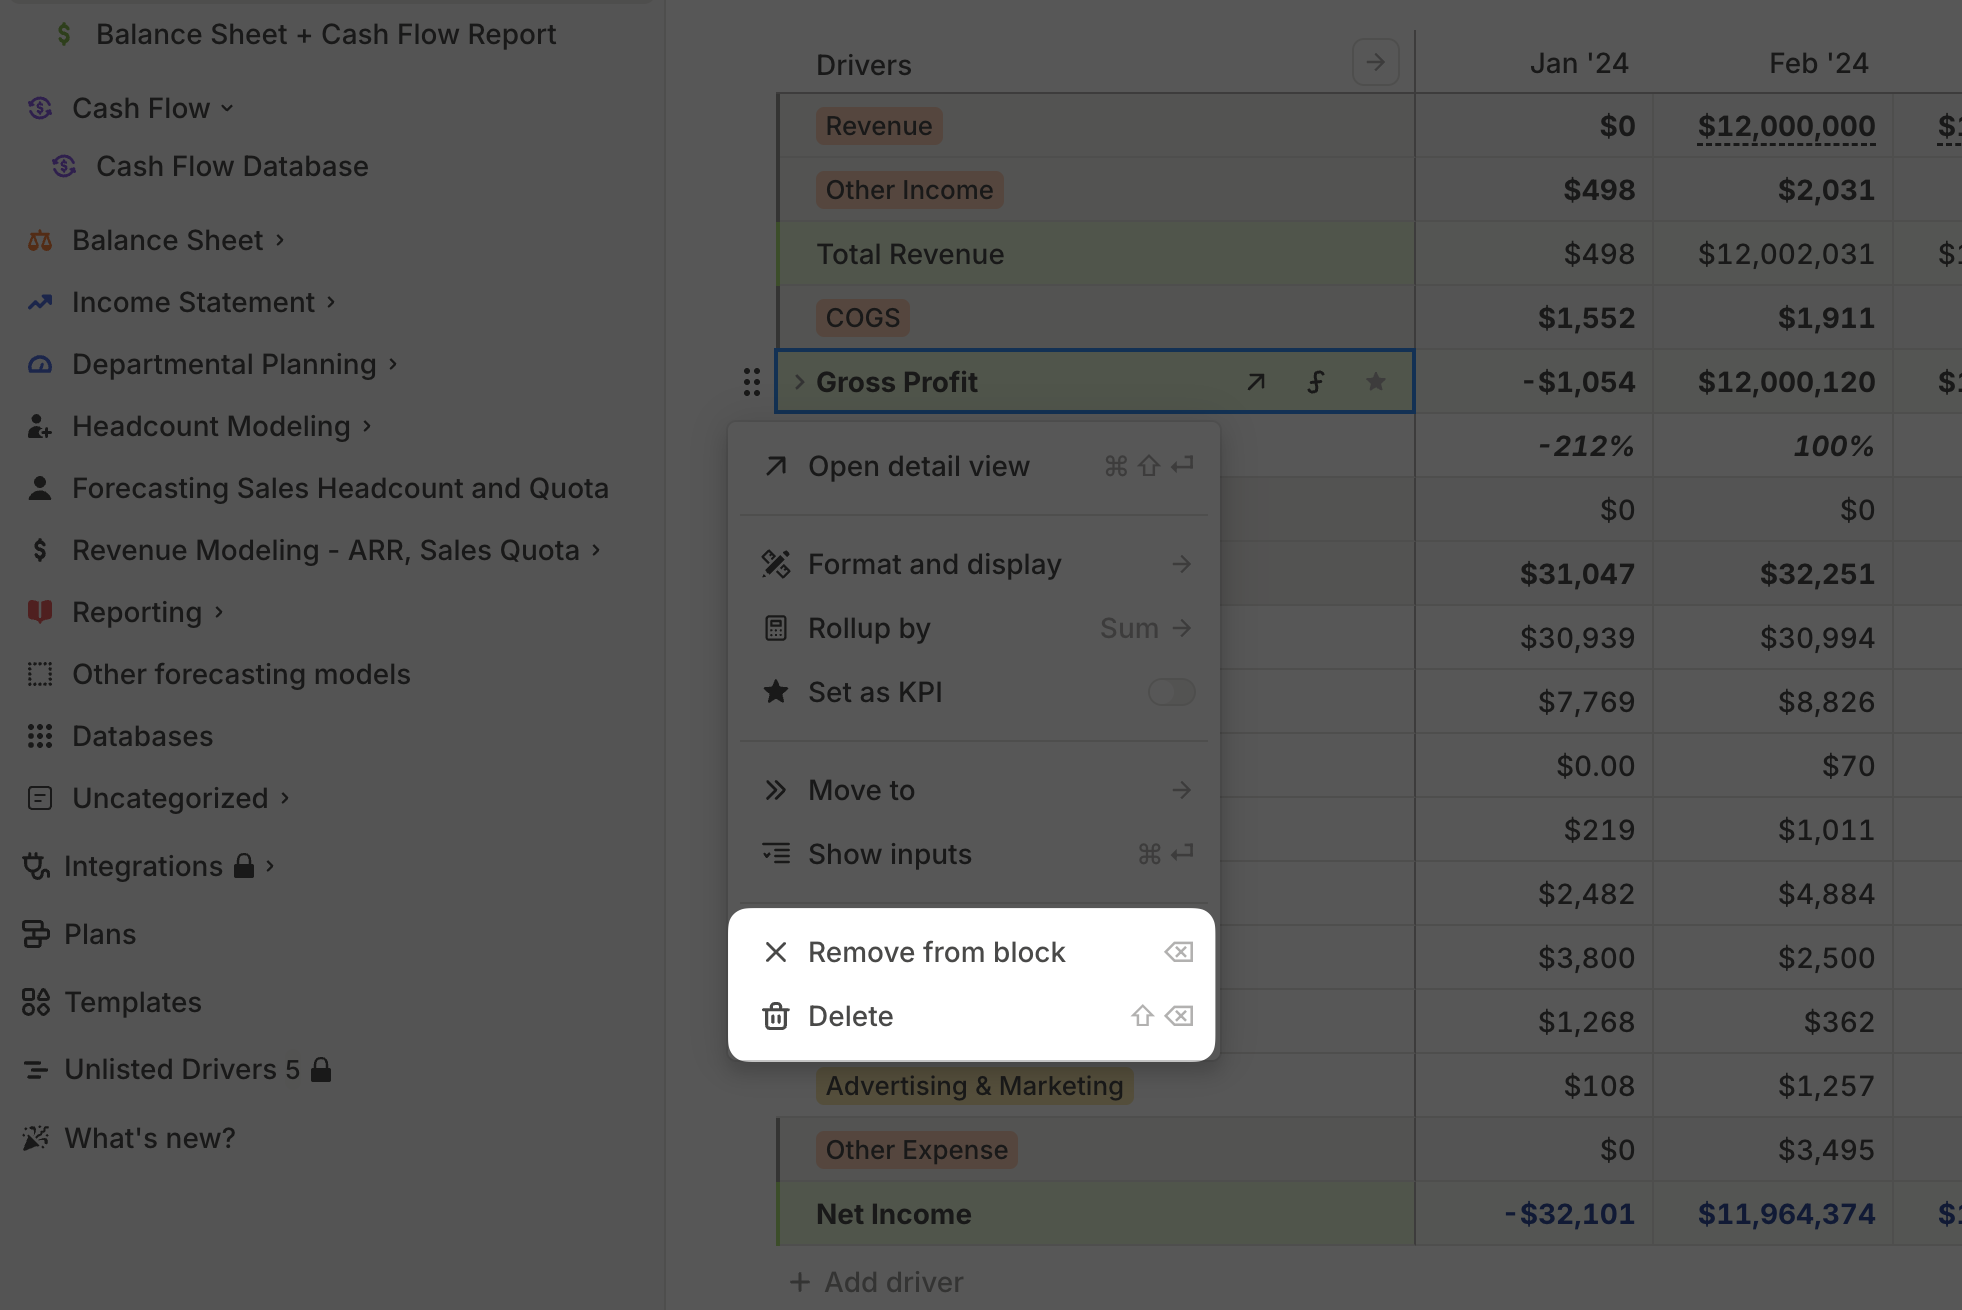
 To remove a driver from the block, select it and press Backspace, or right-click the driver name and select **Remove from block**.
Removing a driver from the block does not delete it from Runway. It only removes that driver from this table. See [Duplicating, removing & deleting](/concepts/drivers/duplicate-remove-delete) for details.
To remove a driver from the block, select it and press Backspace, or right-click the driver name and select **Remove from block**.
Removing a driver from the block does not delete it from Runway. It only removes that driver from this table. See [Duplicating, removing & deleting](/concepts/drivers/duplicate-remove-delete) for details.
 ## Formatting drivers
Drivers retain their existing formatting when added to a table on a page. You can adjust color, text style, indentation, precision, and other formatting, but those changes apply globally wherever the driver appears.
For more details, see [Driver formatting](/concepts/drivers/driver-formatting).
## Time period rollups
### Selecting the time period
By default, data in a driver table block is displayed monthly, with each month as a separate column. Use rollups when you want to show quarters, years, or custom ranges.
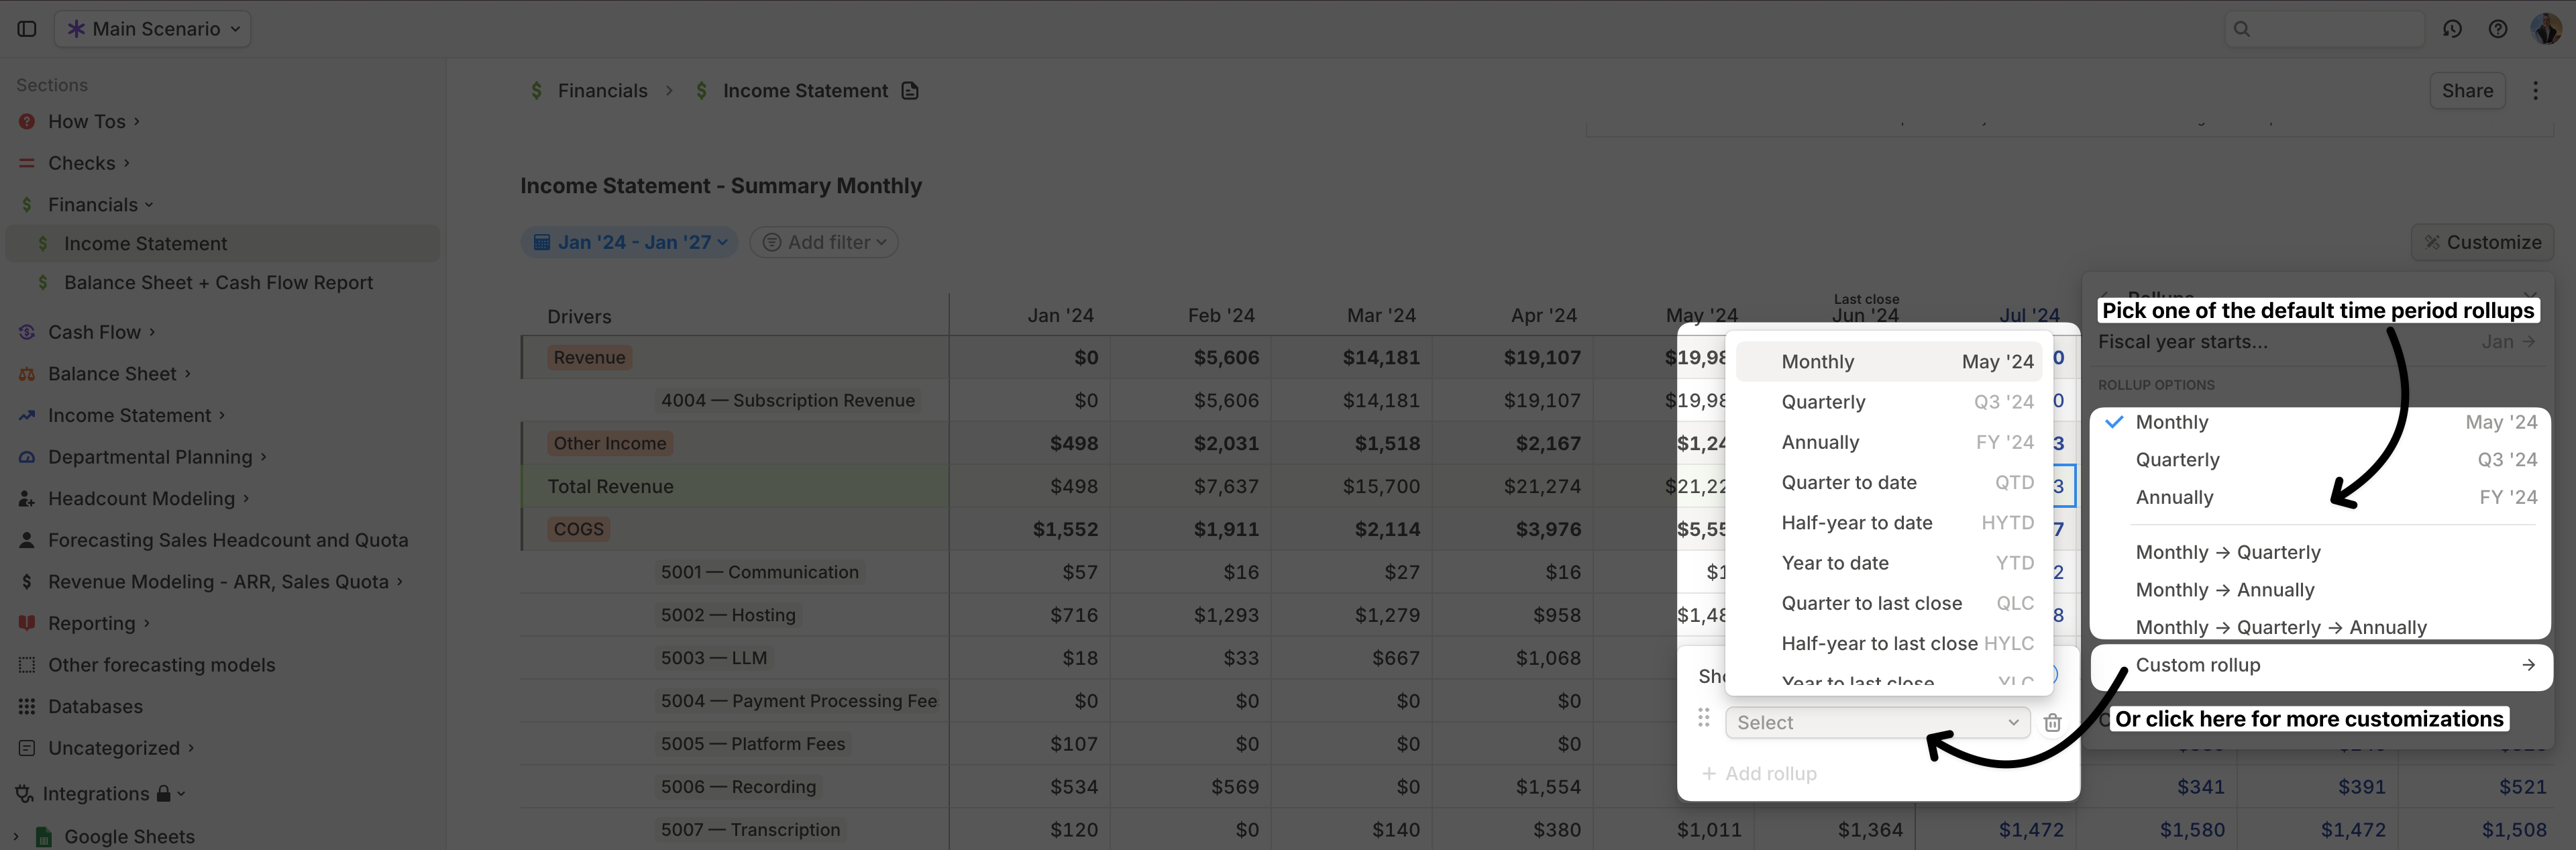
Click **Customize** in the top-right corner, then select **Rollups**.
Choose **Monthly**, **Quarterly**, **Annual**, a combined monthly/quarterly/annual view, or **Custom rollup**.
Custom rollups include quarter-to-date, half-year-to-date, year-to-date, quarter-to-last-close, half-year-to-last-close, year-to-last-close, and trailing 3, 6, or 12 months.
## Formatting drivers
Drivers retain their existing formatting when added to a table on a page. You can adjust color, text style, indentation, precision, and other formatting, but those changes apply globally wherever the driver appears.
For more details, see [Driver formatting](/concepts/drivers/driver-formatting).
## Time period rollups
### Selecting the time period
By default, data in a driver table block is displayed monthly, with each month as a separate column. Use rollups when you want to show quarters, years, or custom ranges.
Click **Customize** in the top-right corner, then select **Rollups**.
Choose **Monthly**, **Quarterly**, **Annual**, a combined monthly/quarterly/annual view, or **Custom rollup**.
Custom rollups include quarter-to-date, half-year-to-date, year-to-date, quarter-to-last-close, half-year-to-last-close, year-to-last-close, and trailing 3, 6, or 12 months.
 ### Selecting the aggregation
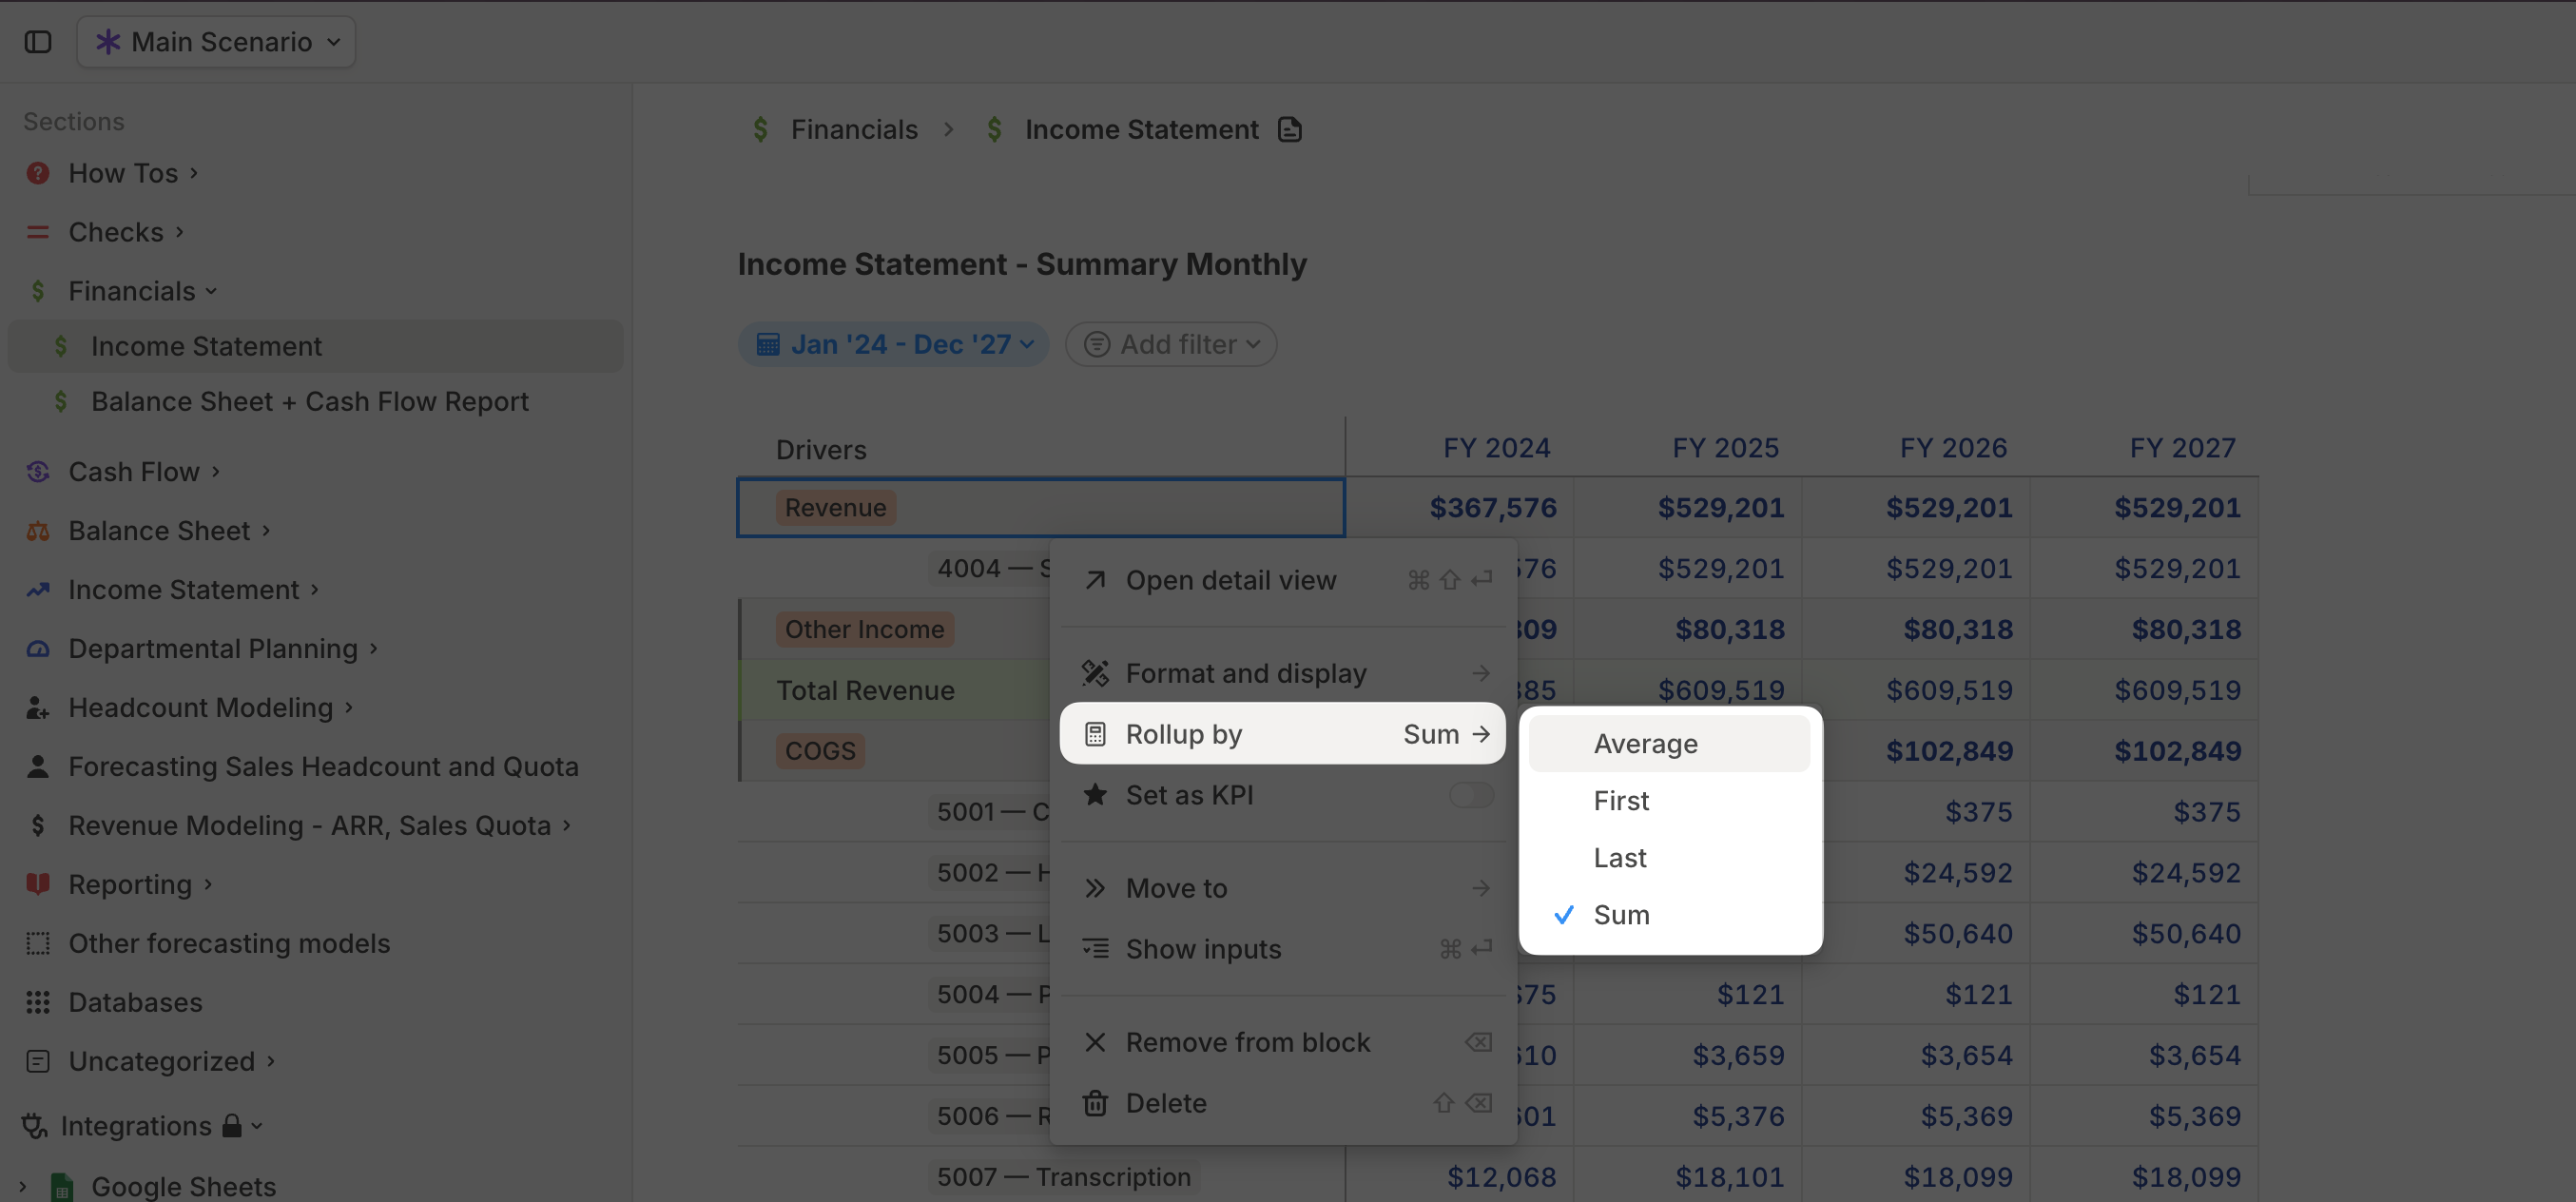
Each driver can define how values aggregate into a coarser time period.
Right-click the driver name and select **Roll up by**.
Choose **Sum**, **Average**, **First**, or **Last**.
### Selecting the aggregation
Each driver can define how values aggregate into a coarser time period.
Right-click the driver name and select **Roll up by**.
Choose **Sum**, **Average**, **First**, or **Last**.
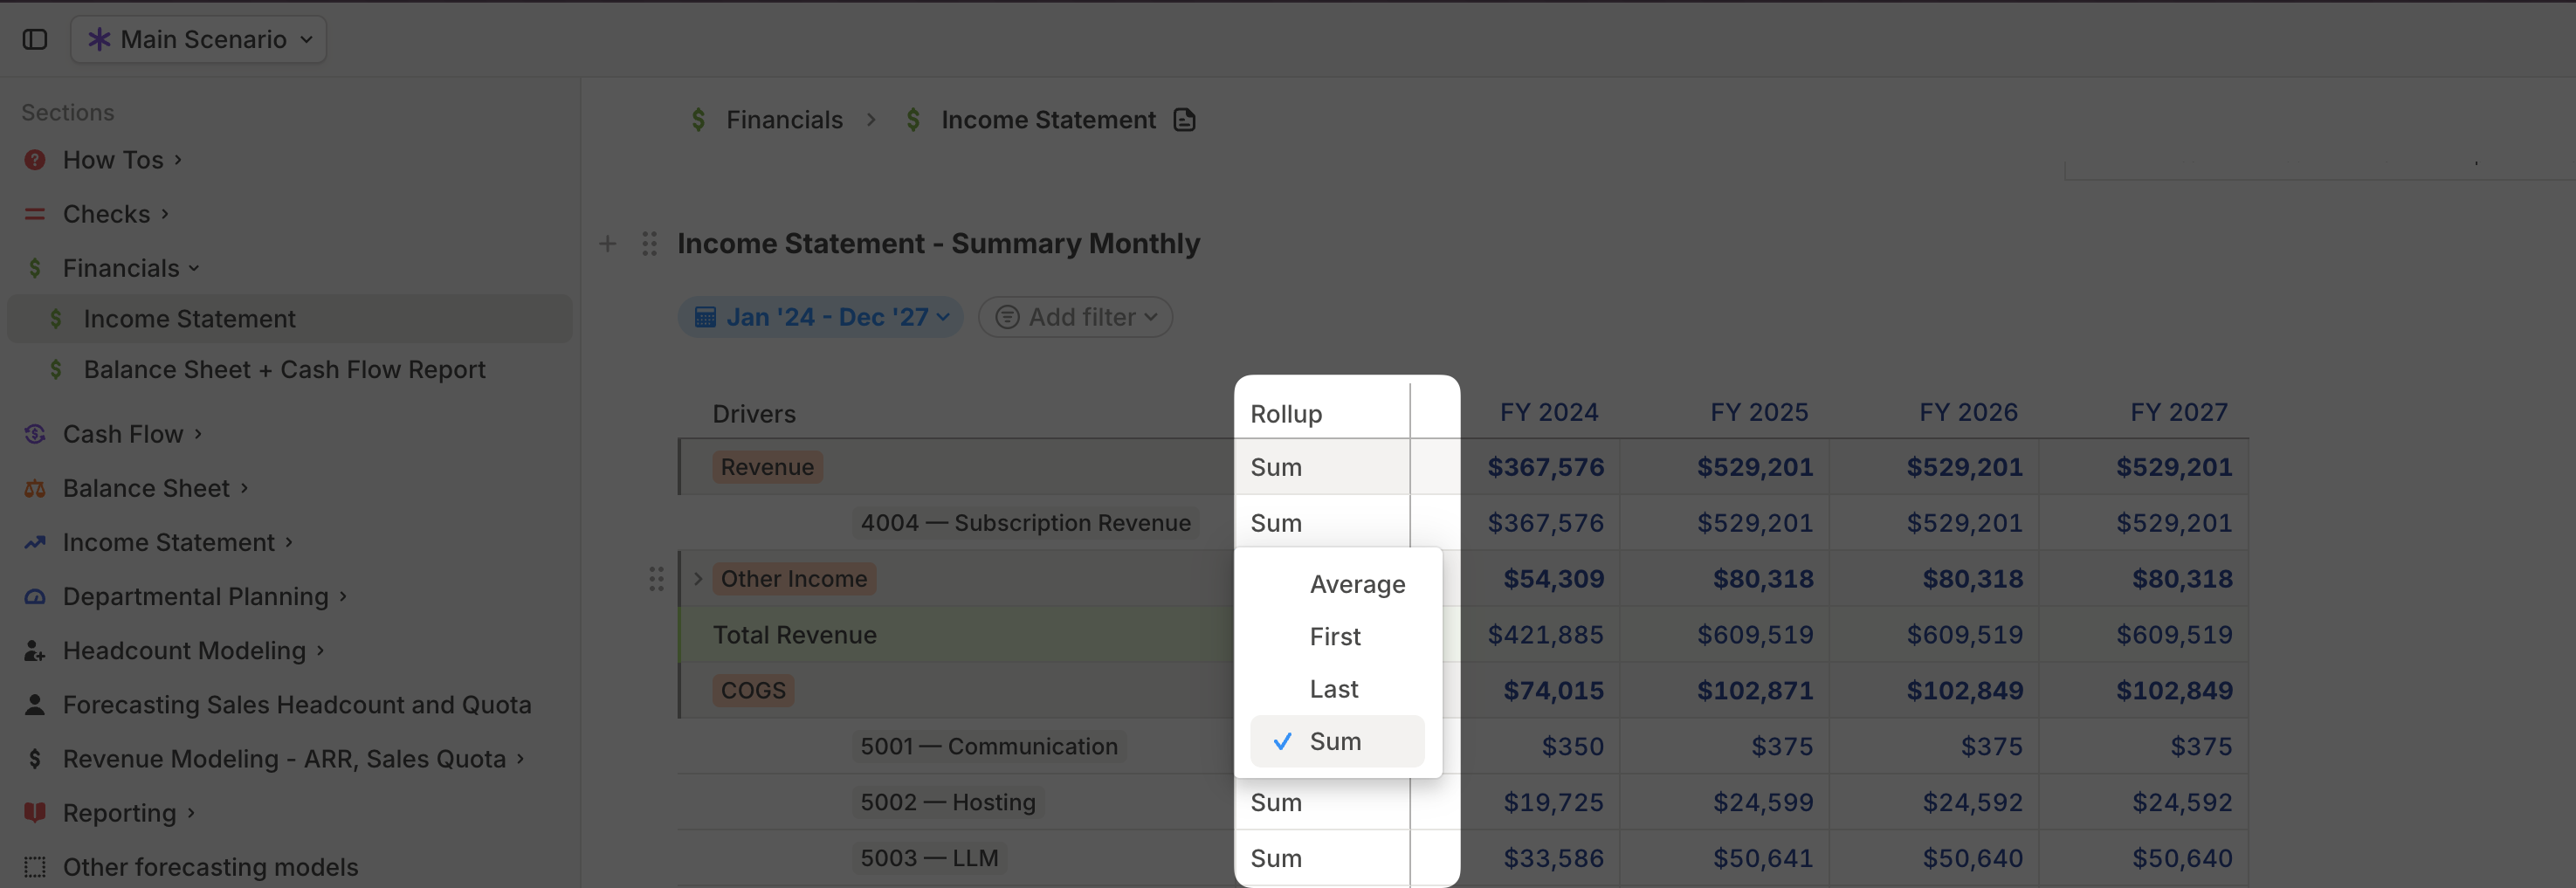
 You can also show the **Rollup** property as a column and adjust aggregation directly from the table.
Click **Customize** > **Properties**, then enable **Rollup**.
Click the **Rollup** cell for a driver and choose its aggregation method.
You can also show the **Rollup** property as a column and adjust aggregation directly from the table.
Click **Customize** > **Properties**, then enable **Rollup**.
Click the **Rollup** cell for a driver and choose its aggregation method.
 ## Comparing drivers across scenarios
Click **Customize** in the top-right corner.
Select **Compare**, then choose the scenarios you want to compare.
For more detail, see [Scenarios](/concepts/scenarios#comparing-scenarios).
## Comparing drivers across time periods
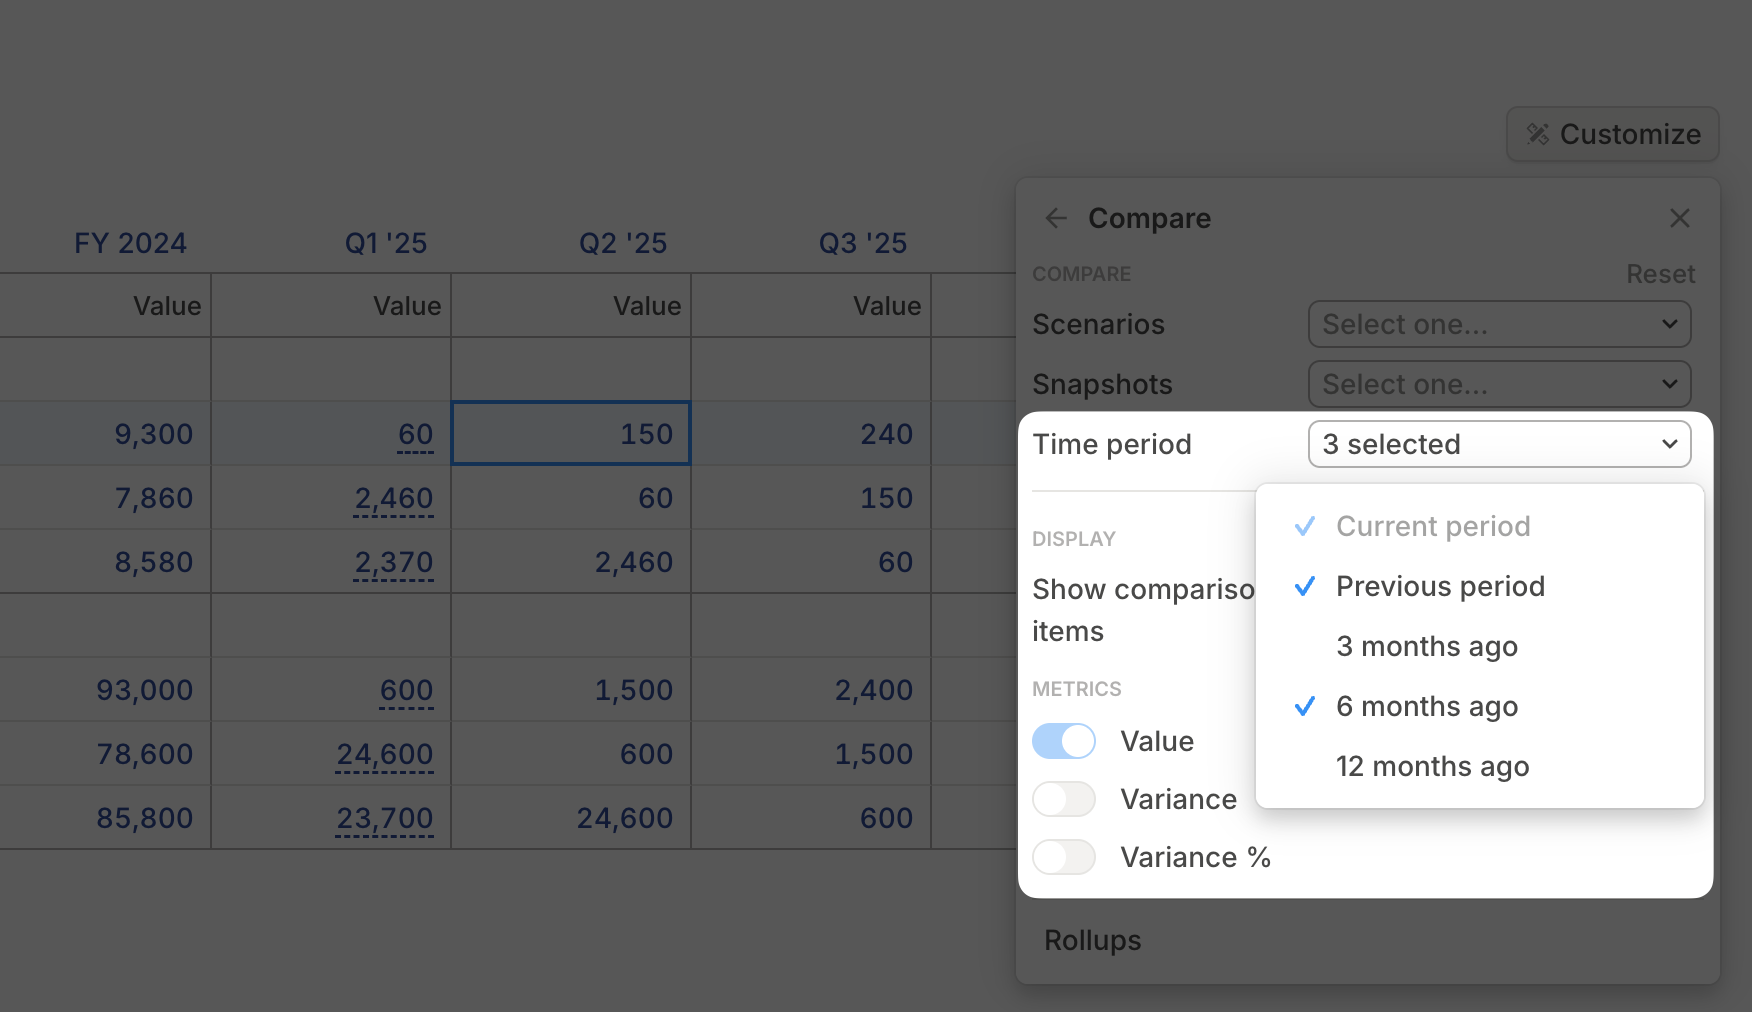
In driver tables, you can compare values over time, such as month-over-month, quarter-over-quarter, or year-over-year.
Click **Customize**, then go to **Compare** > **Time period**.
Choose **Previous period**, **3 months ago**, **6 months ago**, or **12 months ago**.
Pick **Value**, **Variance**, **Variance %**, or a combination.
Each comparison appears as a new row below the original driver.
## Comparing drivers across scenarios
Click **Customize** in the top-right corner.
Select **Compare**, then choose the scenarios you want to compare.
For more detail, see [Scenarios](/concepts/scenarios#comparing-scenarios).
## Comparing drivers across time periods
In driver tables, you can compare values over time, such as month-over-month, quarter-over-quarter, or year-over-year.
Click **Customize**, then go to **Compare** > **Time period**.
Choose **Previous period**, **3 months ago**, **6 months ago**, or **12 months ago**.
Pick **Value**, **Variance**, **Variance %**, or a combination.
Each comparison appears as a new row below the original driver.
 ## Drivers table FAQ
No. Time period comparisons are displayed as rows.
## What's next
* [Charts block](/concepts/pages/charts-block)
* [Driver formatting](/concepts/drivers/driver-formatting)
* [Keyboard shortcuts](/get-started/keyboard-shortcuts)
## Drivers table FAQ
No. Time period comparisons are displayed as rows.
## What's next
* [Charts block](/concepts/pages/charts-block)
* [Driver formatting](/concepts/drivers/driver-formatting)
* [Keyboard shortcuts](/get-started/keyboard-shortcuts)