> ## Documentation Index
> Fetch the complete documentation index at: https://docs.runway.com/llms.txt
> Use this file to discover all available pages before exploring further.
# Commissions
> Learn how to connect your Sales Team database to a Deals database sourced from your CRM and build commission logic.
## Step 1: Map CRM deal owners to AEs
To align commissions to individual AEs, you’ll need to connect CRM data to HRIS data.
1. Create a new database called **Account Owner Mapping**. Select your **Sales Team** database as the source and segment by **Name**.
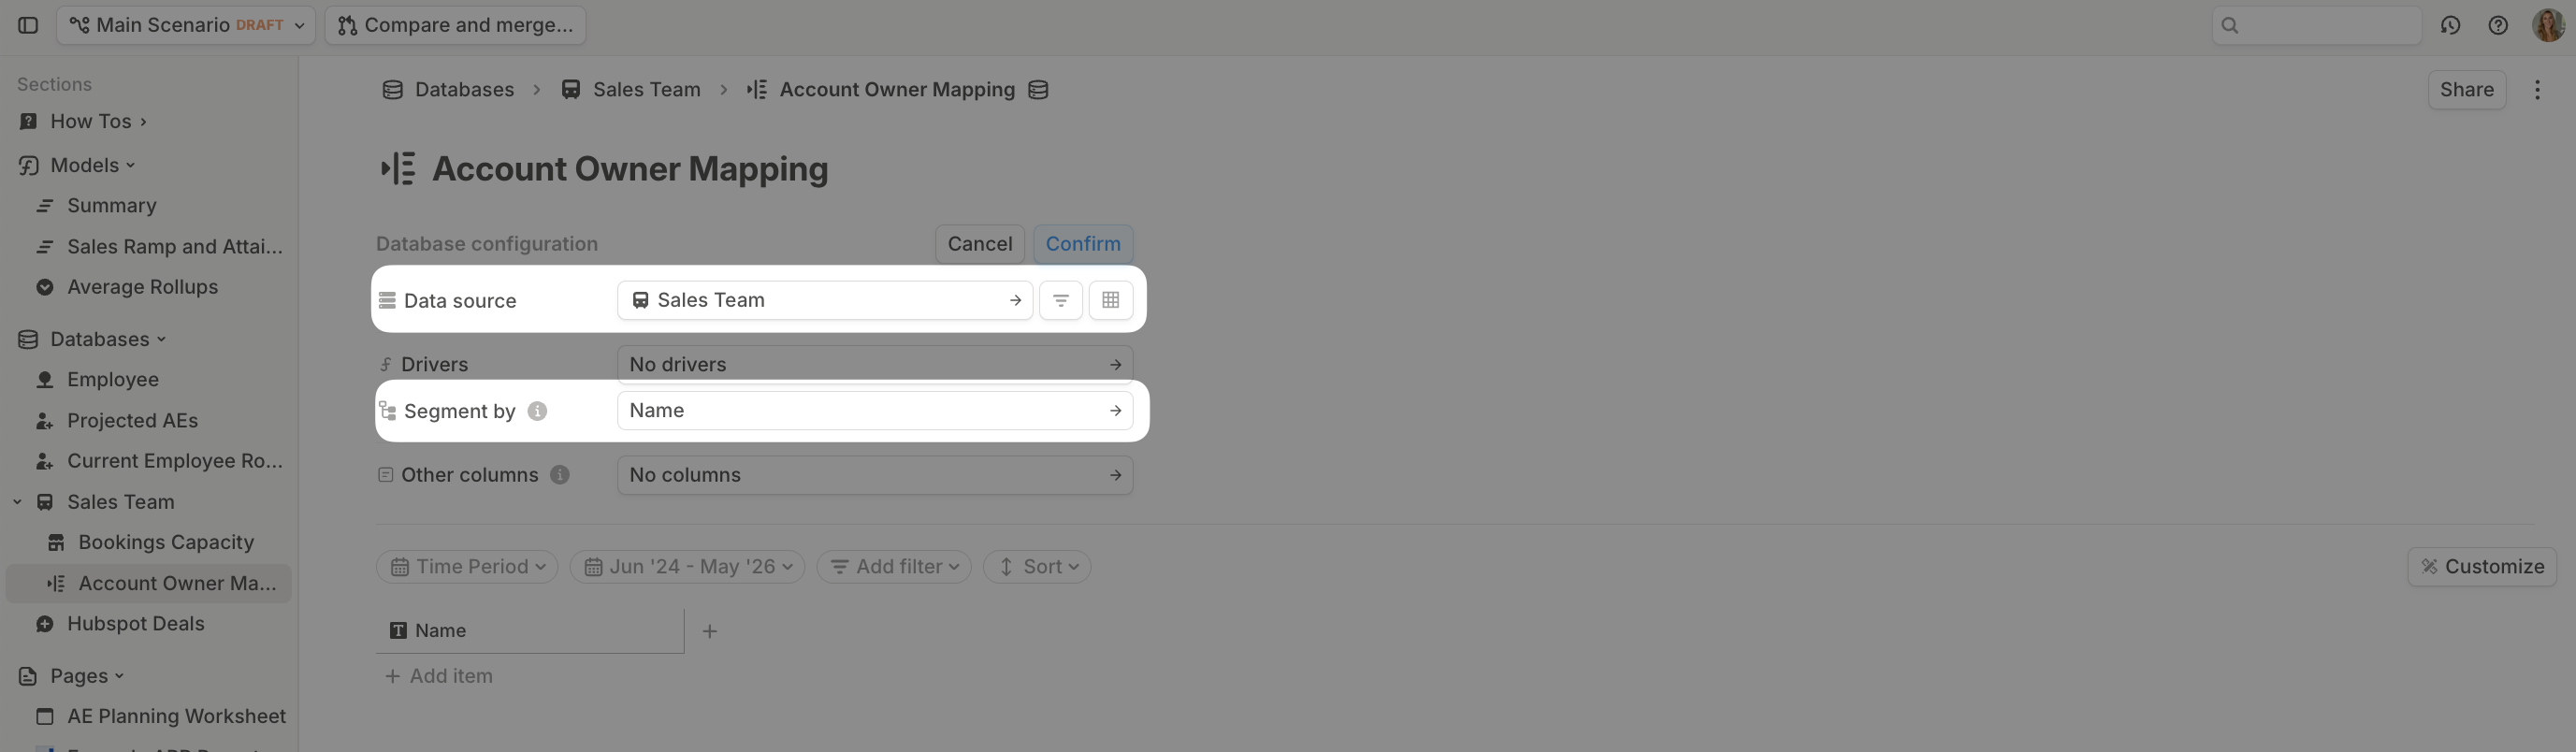 This will create a line for each **Name** value in the **Sales Team** database.
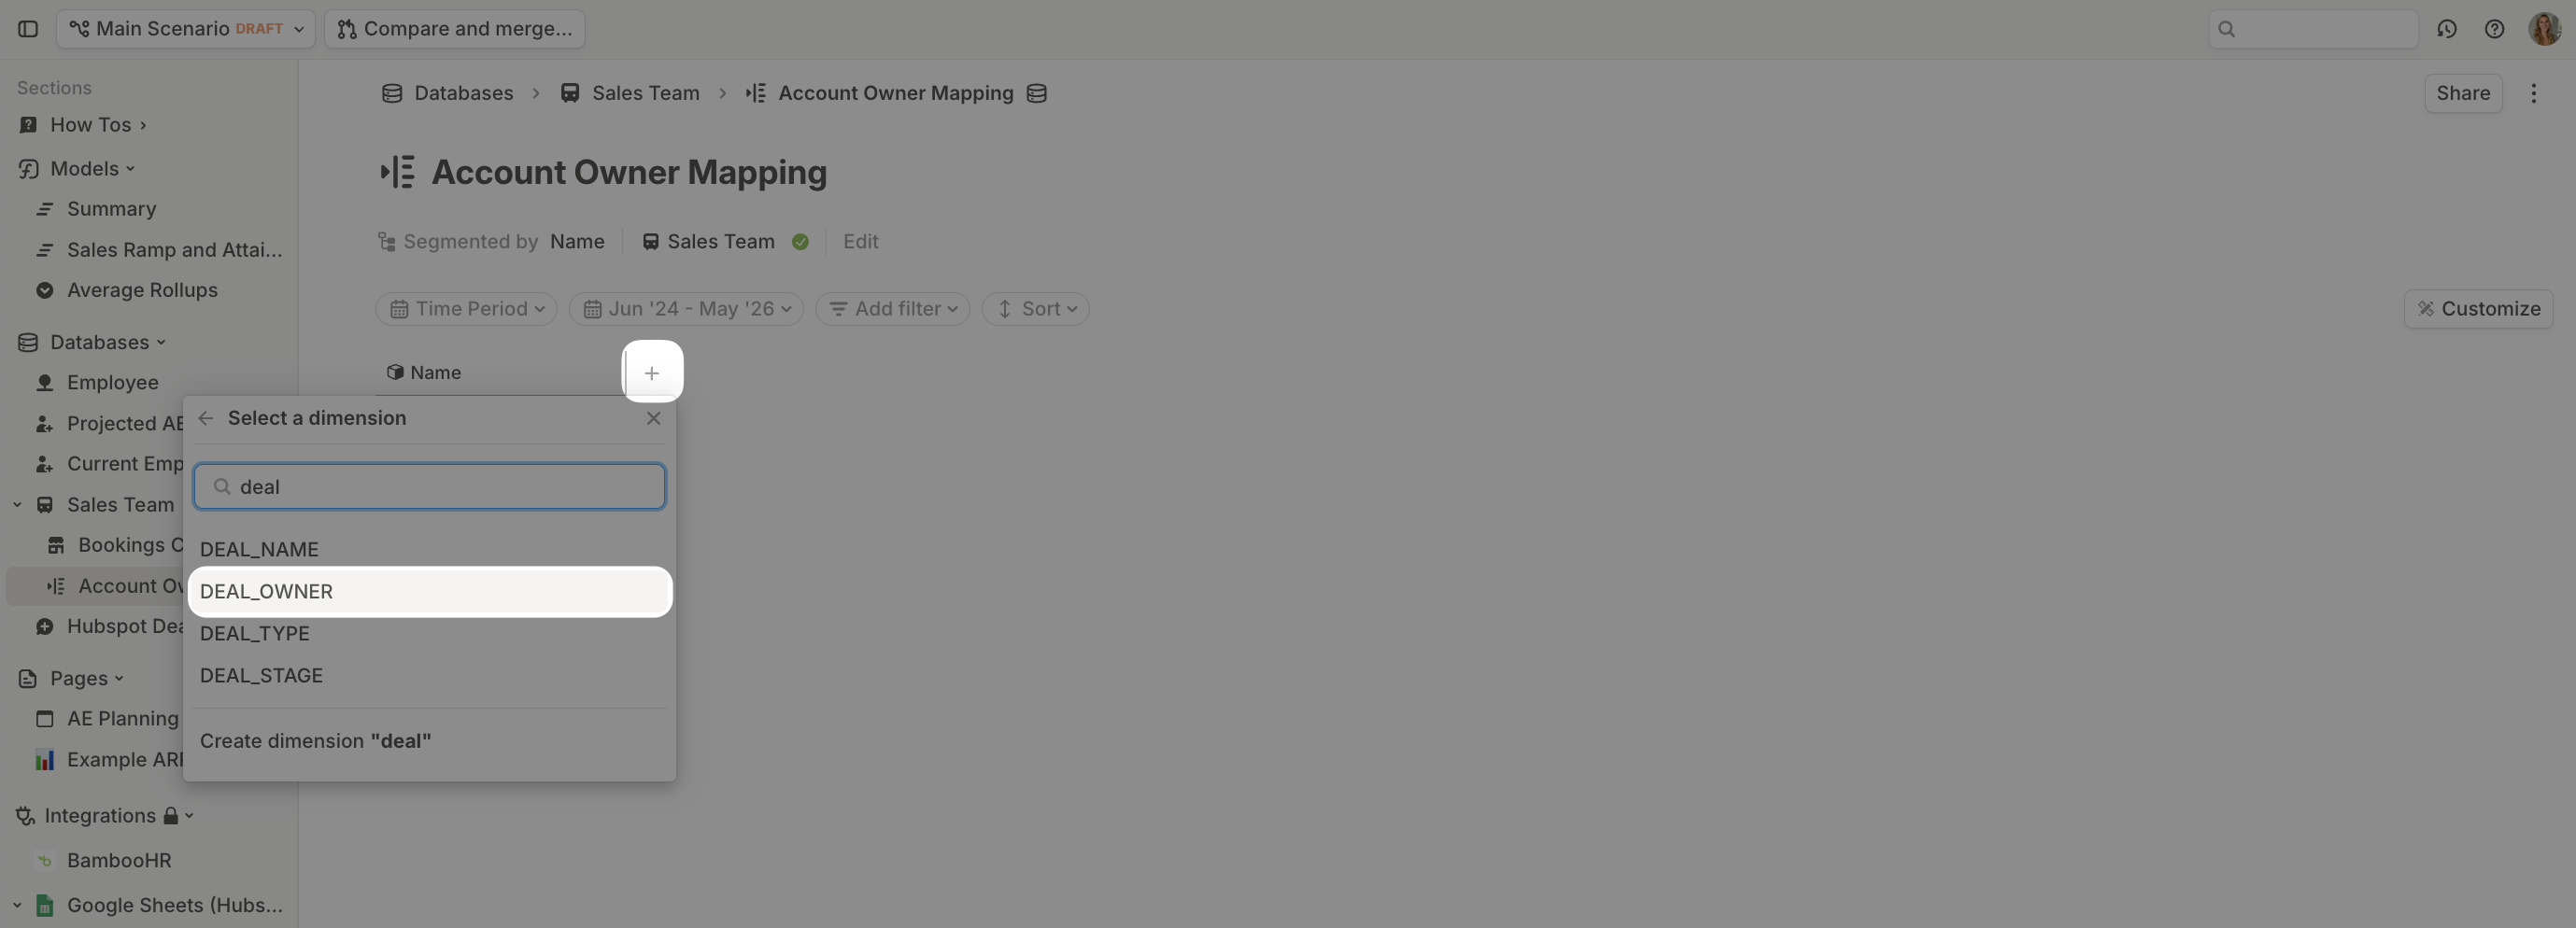
2. Add a new dimension column and search for **Deal Owner**. Naming may vary depending on your HRIS integration. You can always check your **Deals** database for the exact dimension name.
This will create a line for each **Name** value in the **Sales Team** database.
2. Add a new dimension column and search for **Deal Owner**. Naming may vary depending on your HRIS integration. You can always check your **Deals** database for the exact dimension name.
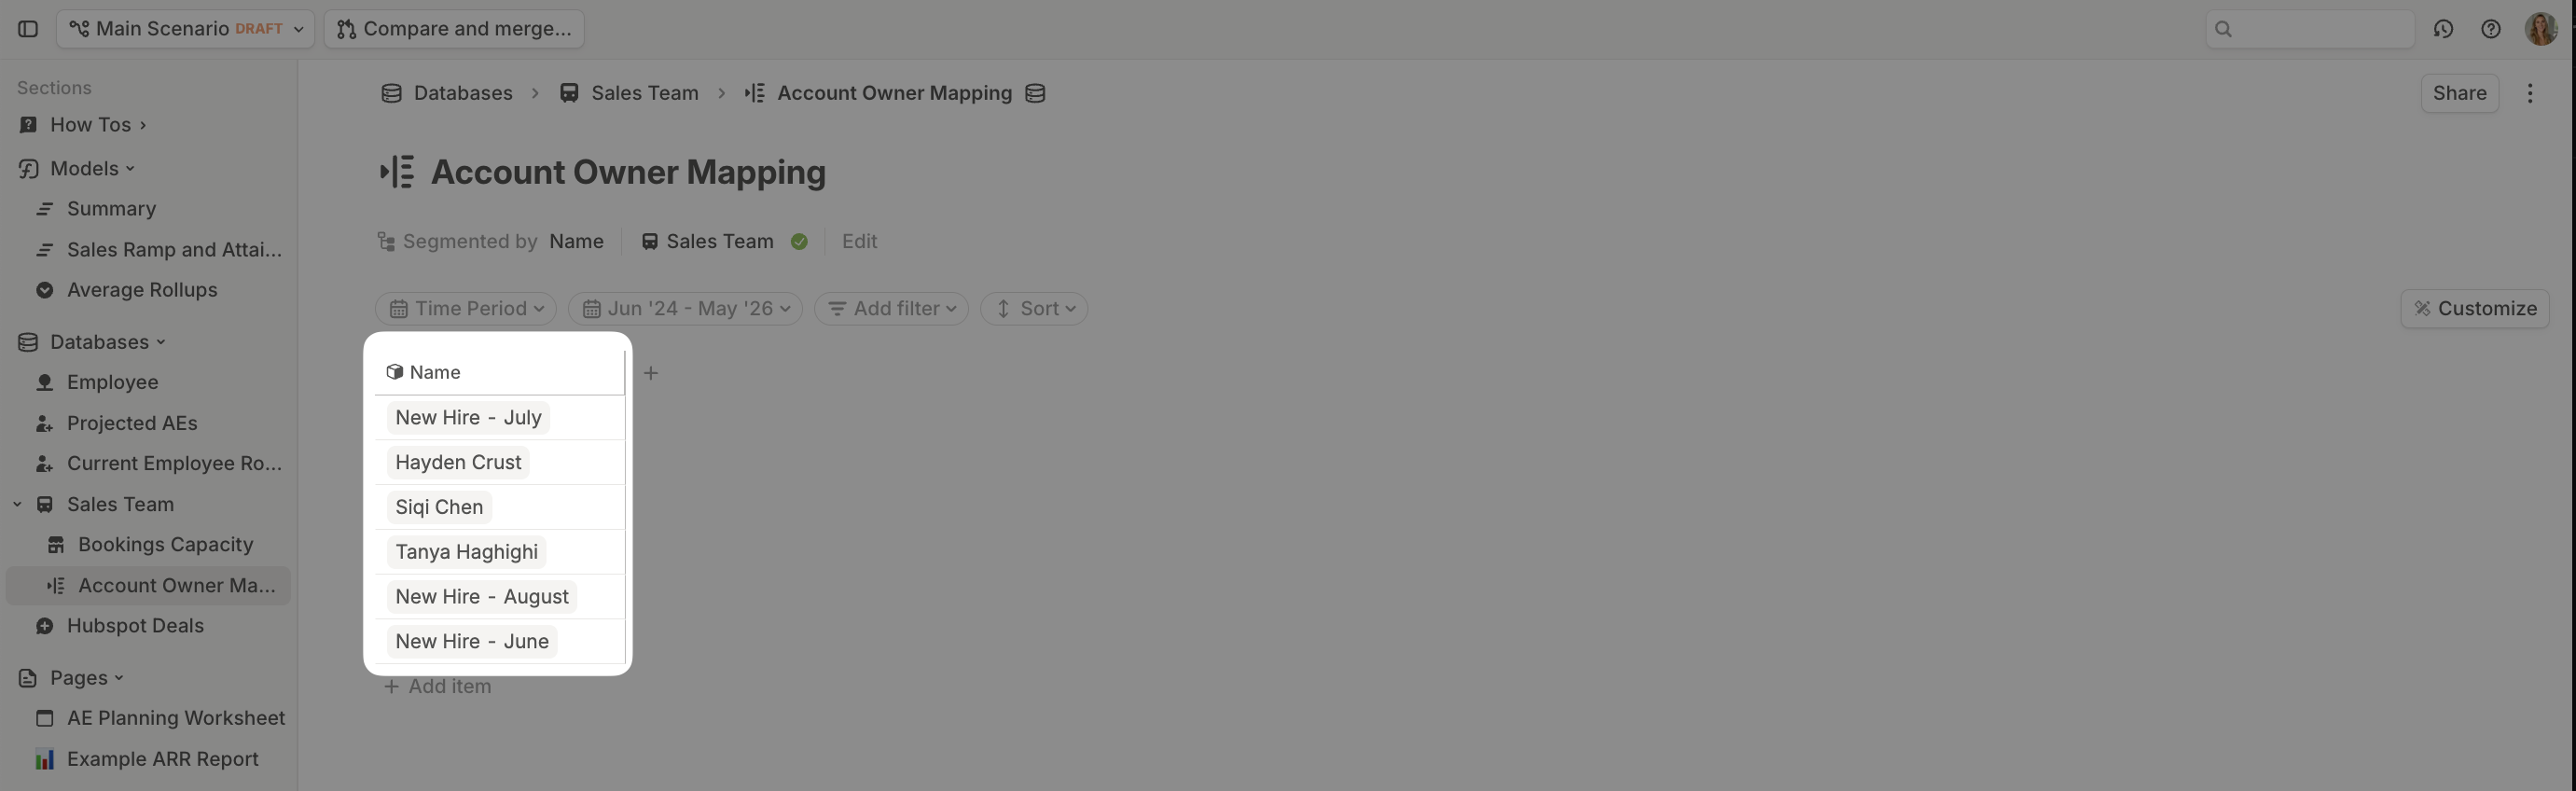
 3. For each relevant row, select the matching **Deal Owner**. Skip rows for manually added new hires—they won’t exist in your CRM data.
 4. In your **Deals** database, add a **Lookup** for the **Name** column.
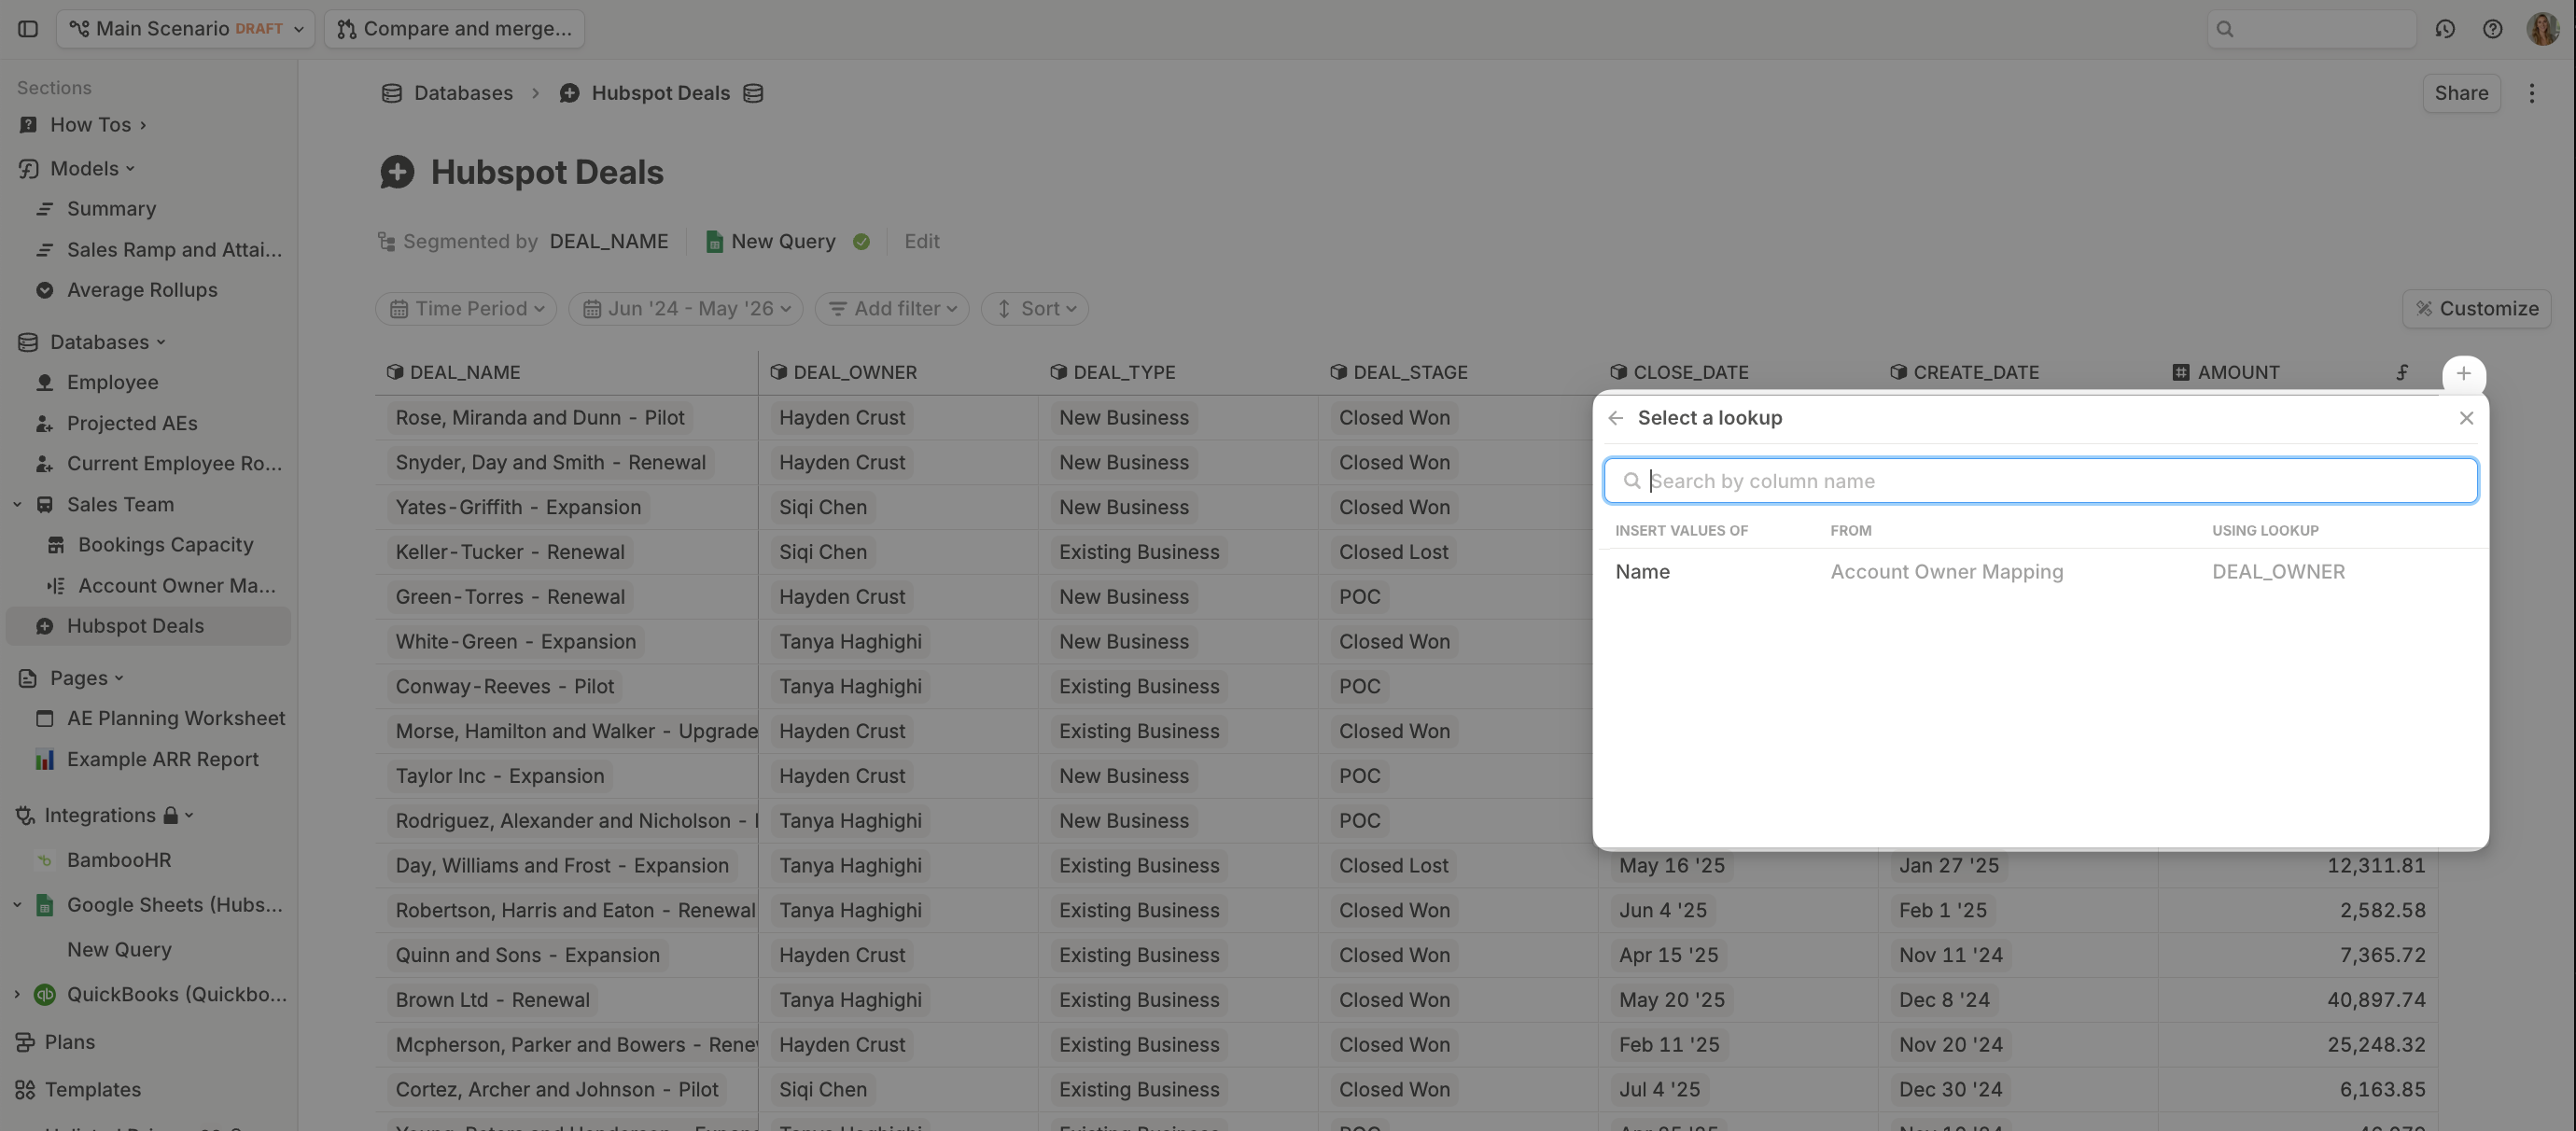 This auto-matches the records for each line. You can think about this as a human-readable VLOOKUP() from Excel. For tidiness, you can hide one of the columns by right-clicking the column header and selecting **Hide in block.**
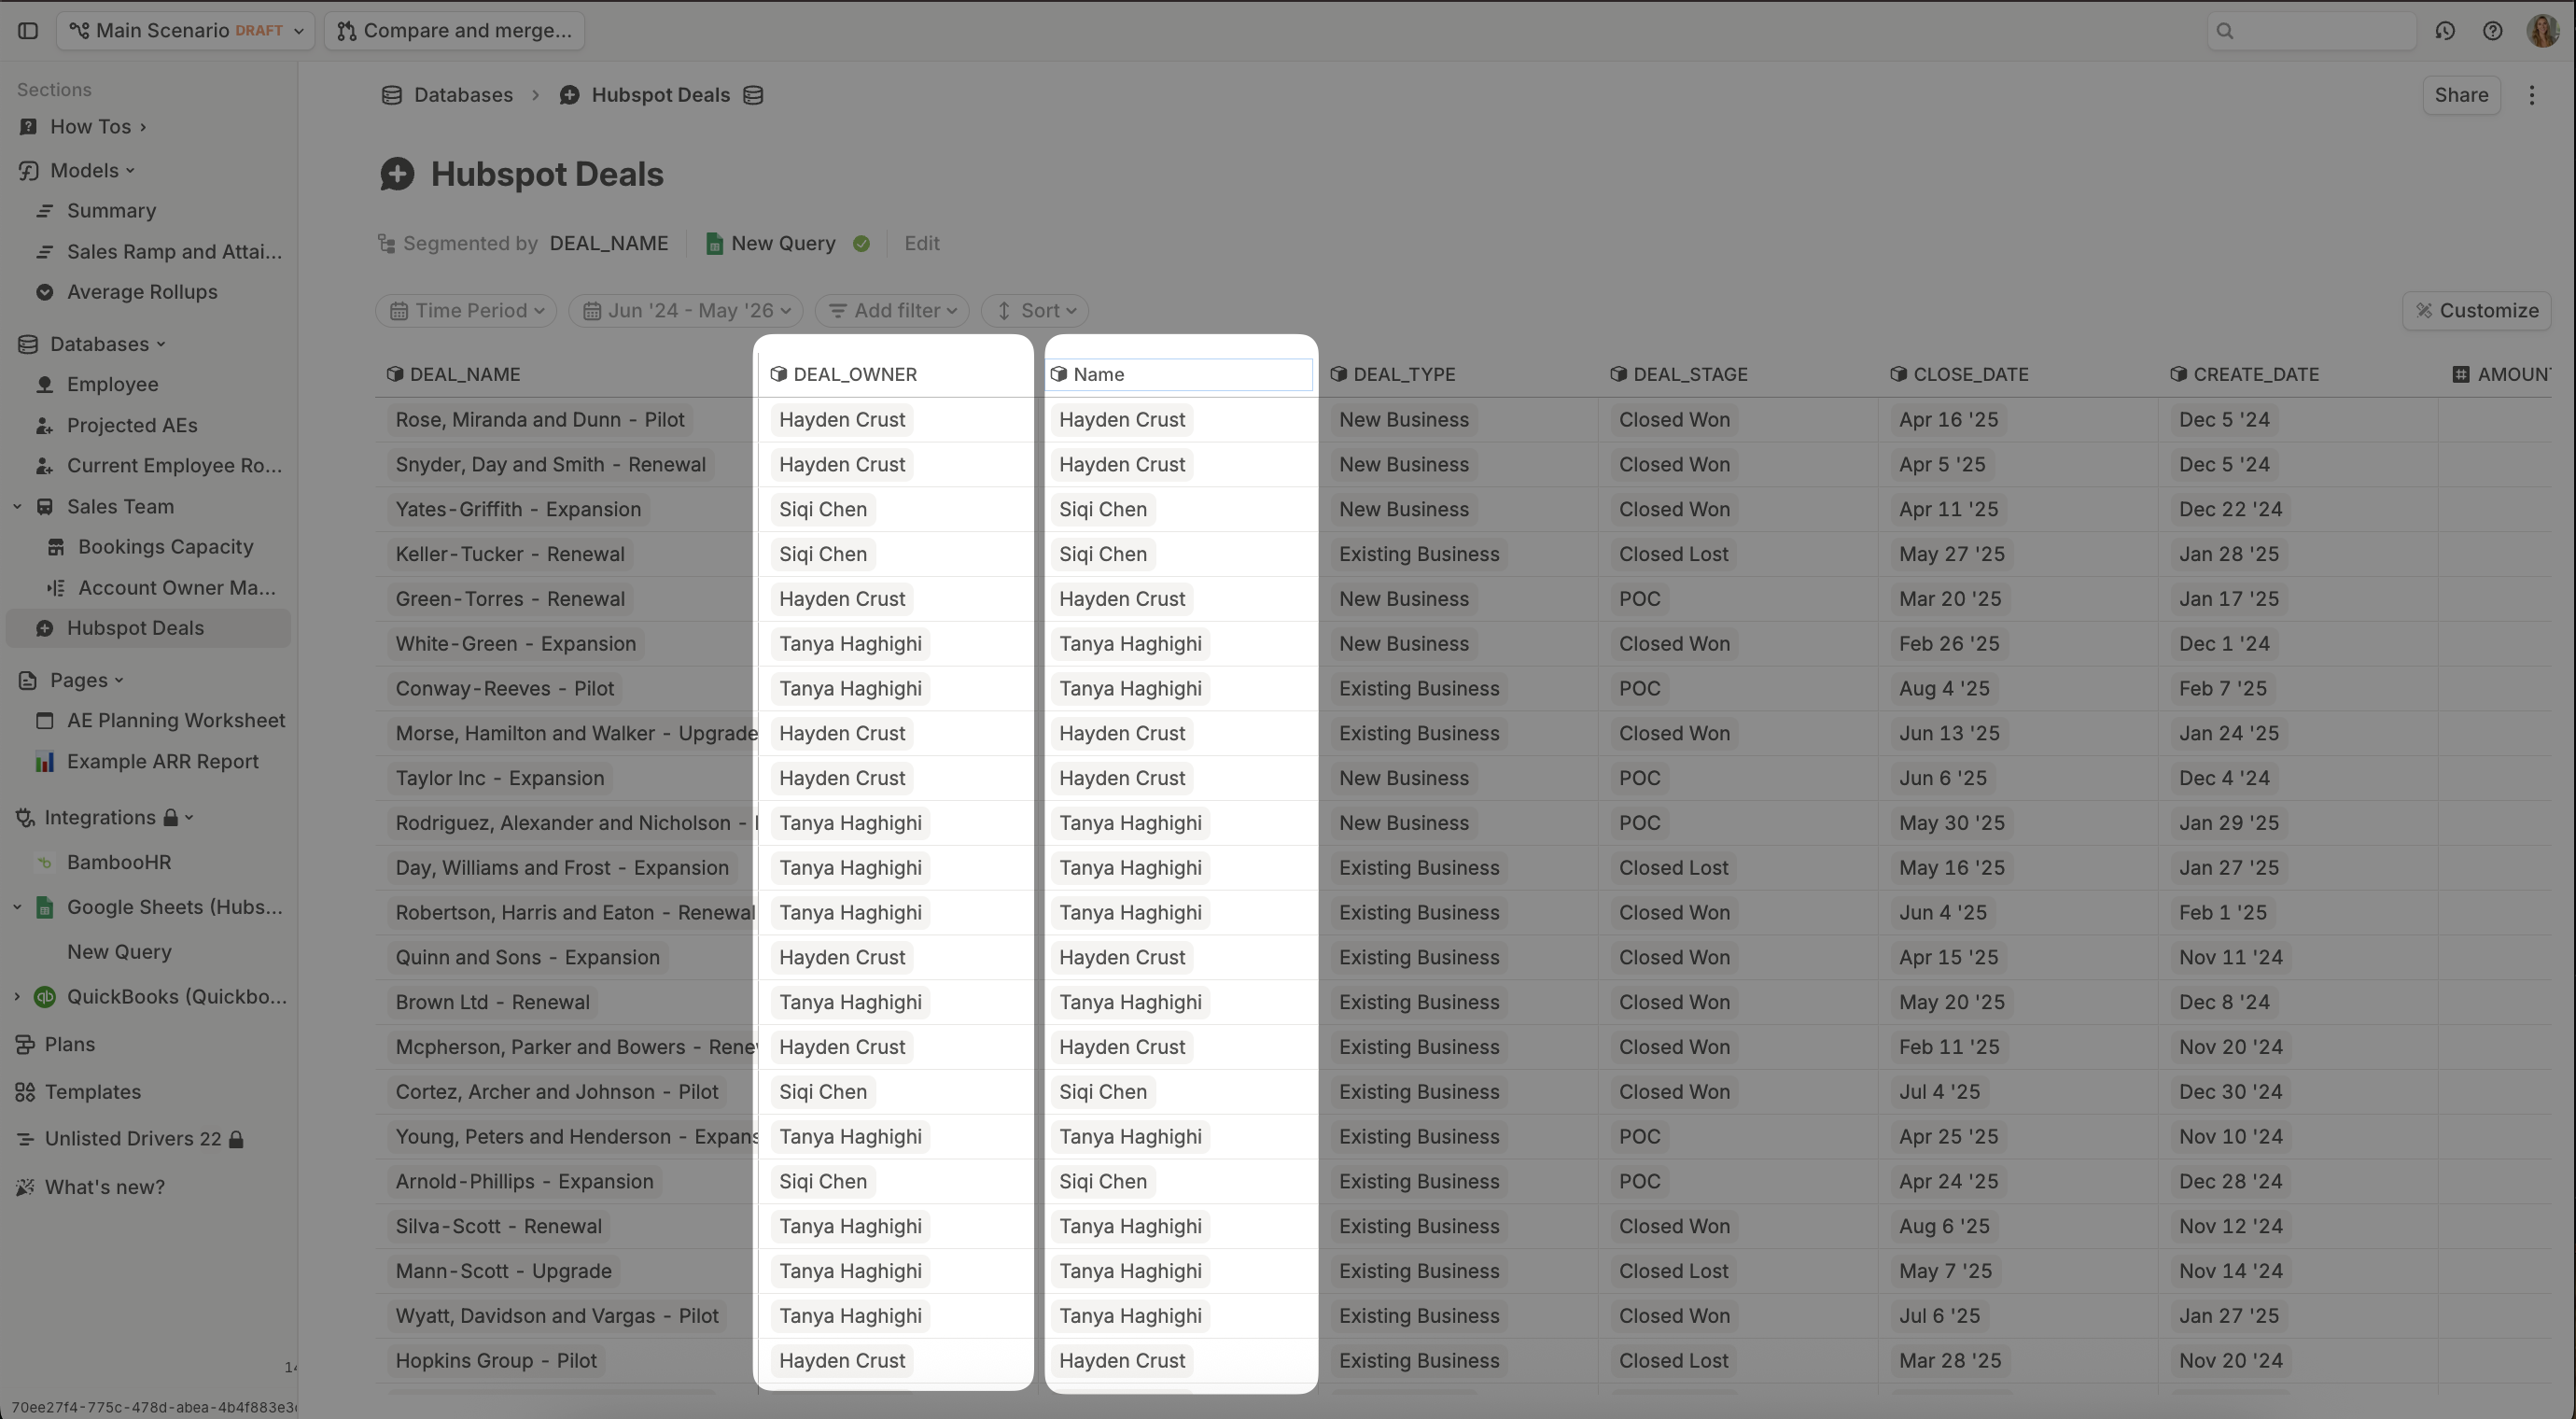 Note: As new employees are hired, you’ll want to revisit the **Account Owner Mapping** to connect their HRIS record to their CRM record.
## Step 2: Add commission rate logic
Create a new number driver column in the **Deals** database called **Commission Rate**.
### **Option 1: Flat rate commission**
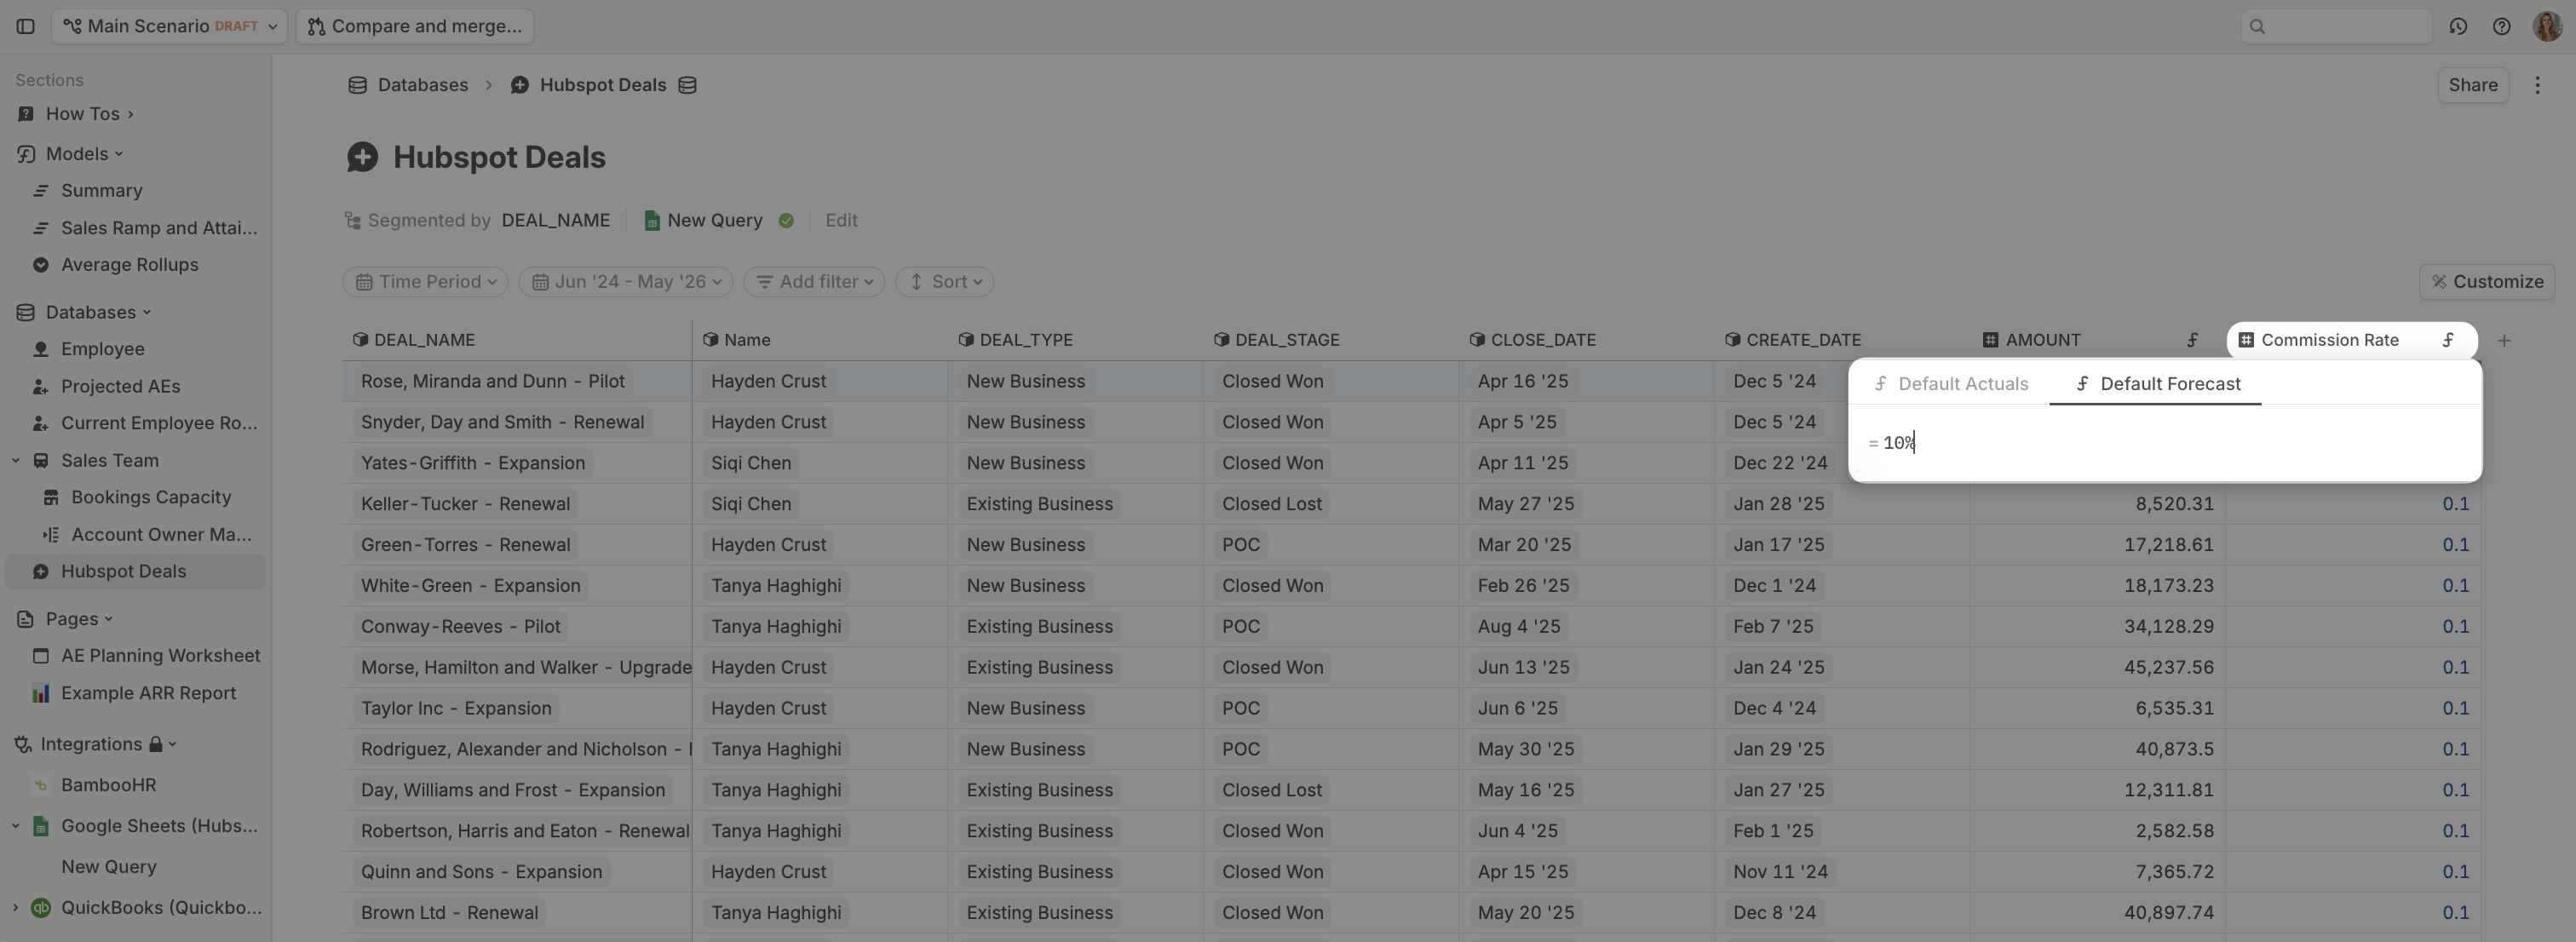
To set a flat commission rate %, you can select `Add default formula` from the column header sub-menu and hardcode a percentage.
Note: As new employees are hired, you’ll want to revisit the **Account Owner Mapping** to connect their HRIS record to their CRM record.
## Step 2: Add commission rate logic
Create a new number driver column in the **Deals** database called **Commission Rate**.
### **Option 1: Flat rate commission**
To set a flat commission rate %, you can select `Add default formula` from the column header sub-menu and hardcode a percentage.
 ### **Option 2: Variable commission rates**
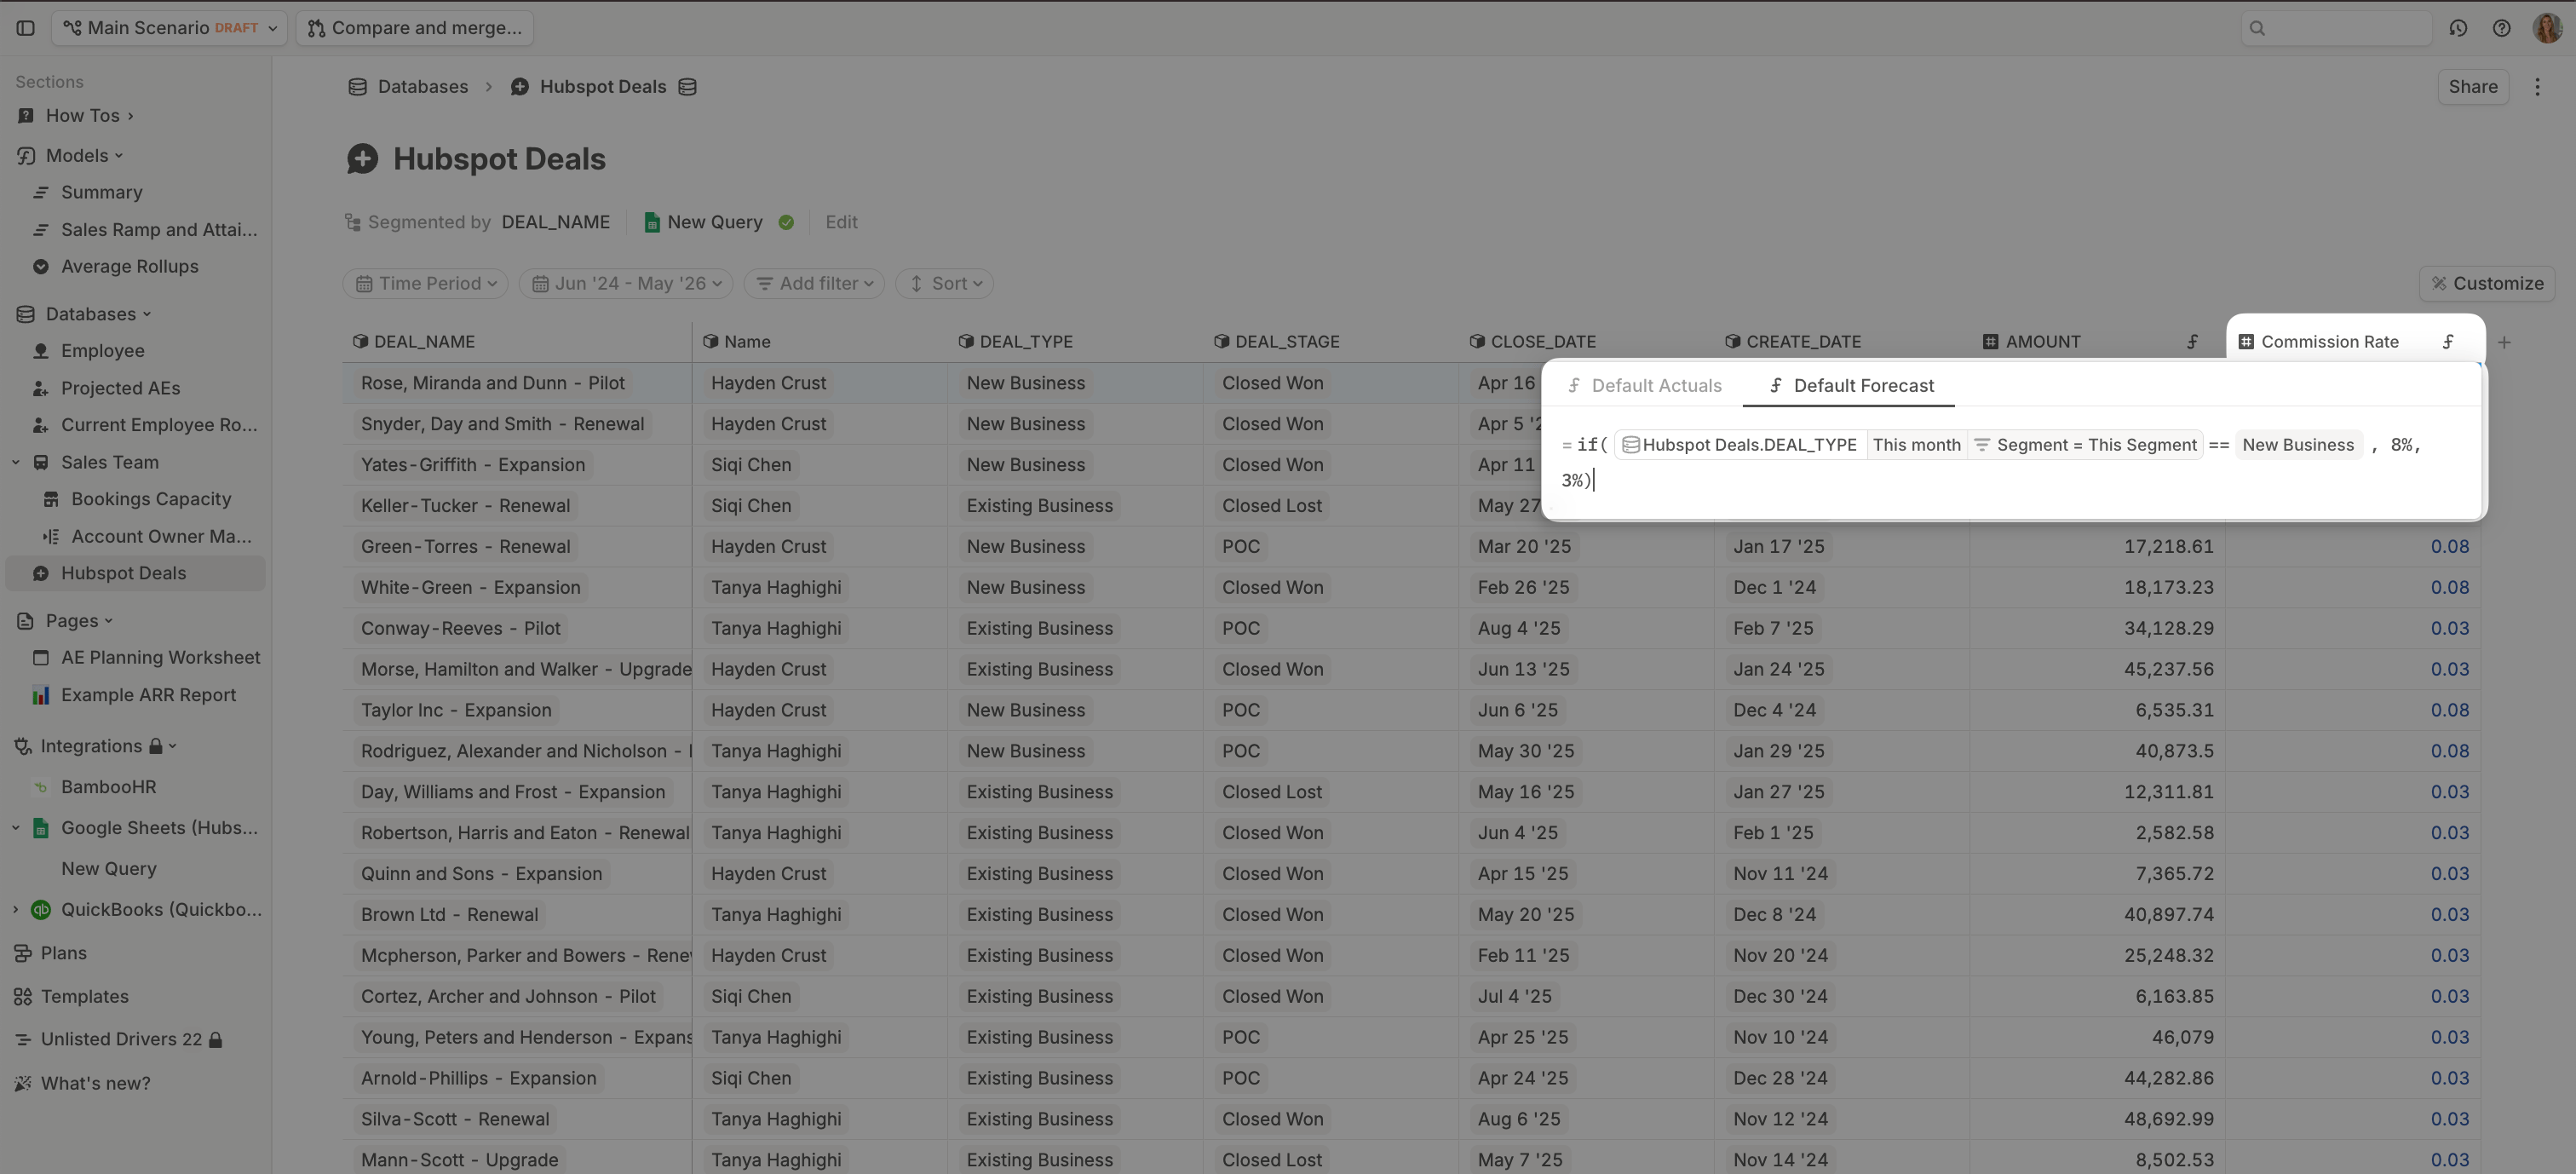
This example demonstrates how you can set assumptions based on dimension values. In this example, `New Business` deals earn an 8% commission, whereas `Existing Business` deals earn a 3% commission.
* The formula references the dimension column `DEAL_TYPE` which only contains the two items: `New Business` or `Existing Business`.
* The logic of the formula reads: *if DEAL\_TYPE = New Business apply an 8% Commission Rate, otherwise apply 3% Commission Rate.*
### **Option 2: Variable commission rates**
This example demonstrates how you can set assumptions based on dimension values. In this example, `New Business` deals earn an 8% commission, whereas `Existing Business` deals earn a 3% commission.
* The formula references the dimension column `DEAL_TYPE` which only contains the two items: `New Business` or `Existing Business`.
* The logic of the formula reads: *if DEAL\_TYPE = New Business apply an 8% Commission Rate, otherwise apply 3% Commission Rate.*
 Since commissions data is part of compensation, many model owners choose to anonymize commission rates and payouts. To do so, right-click the driver column header and toggle **Anonymize data**. You can read more about anonymizing data [here](/guides/sharing/data-anonymization).
## Step 3: Add payout timing logic
In many organizations, commission payouts are deferred until a contract has been active for a set period.
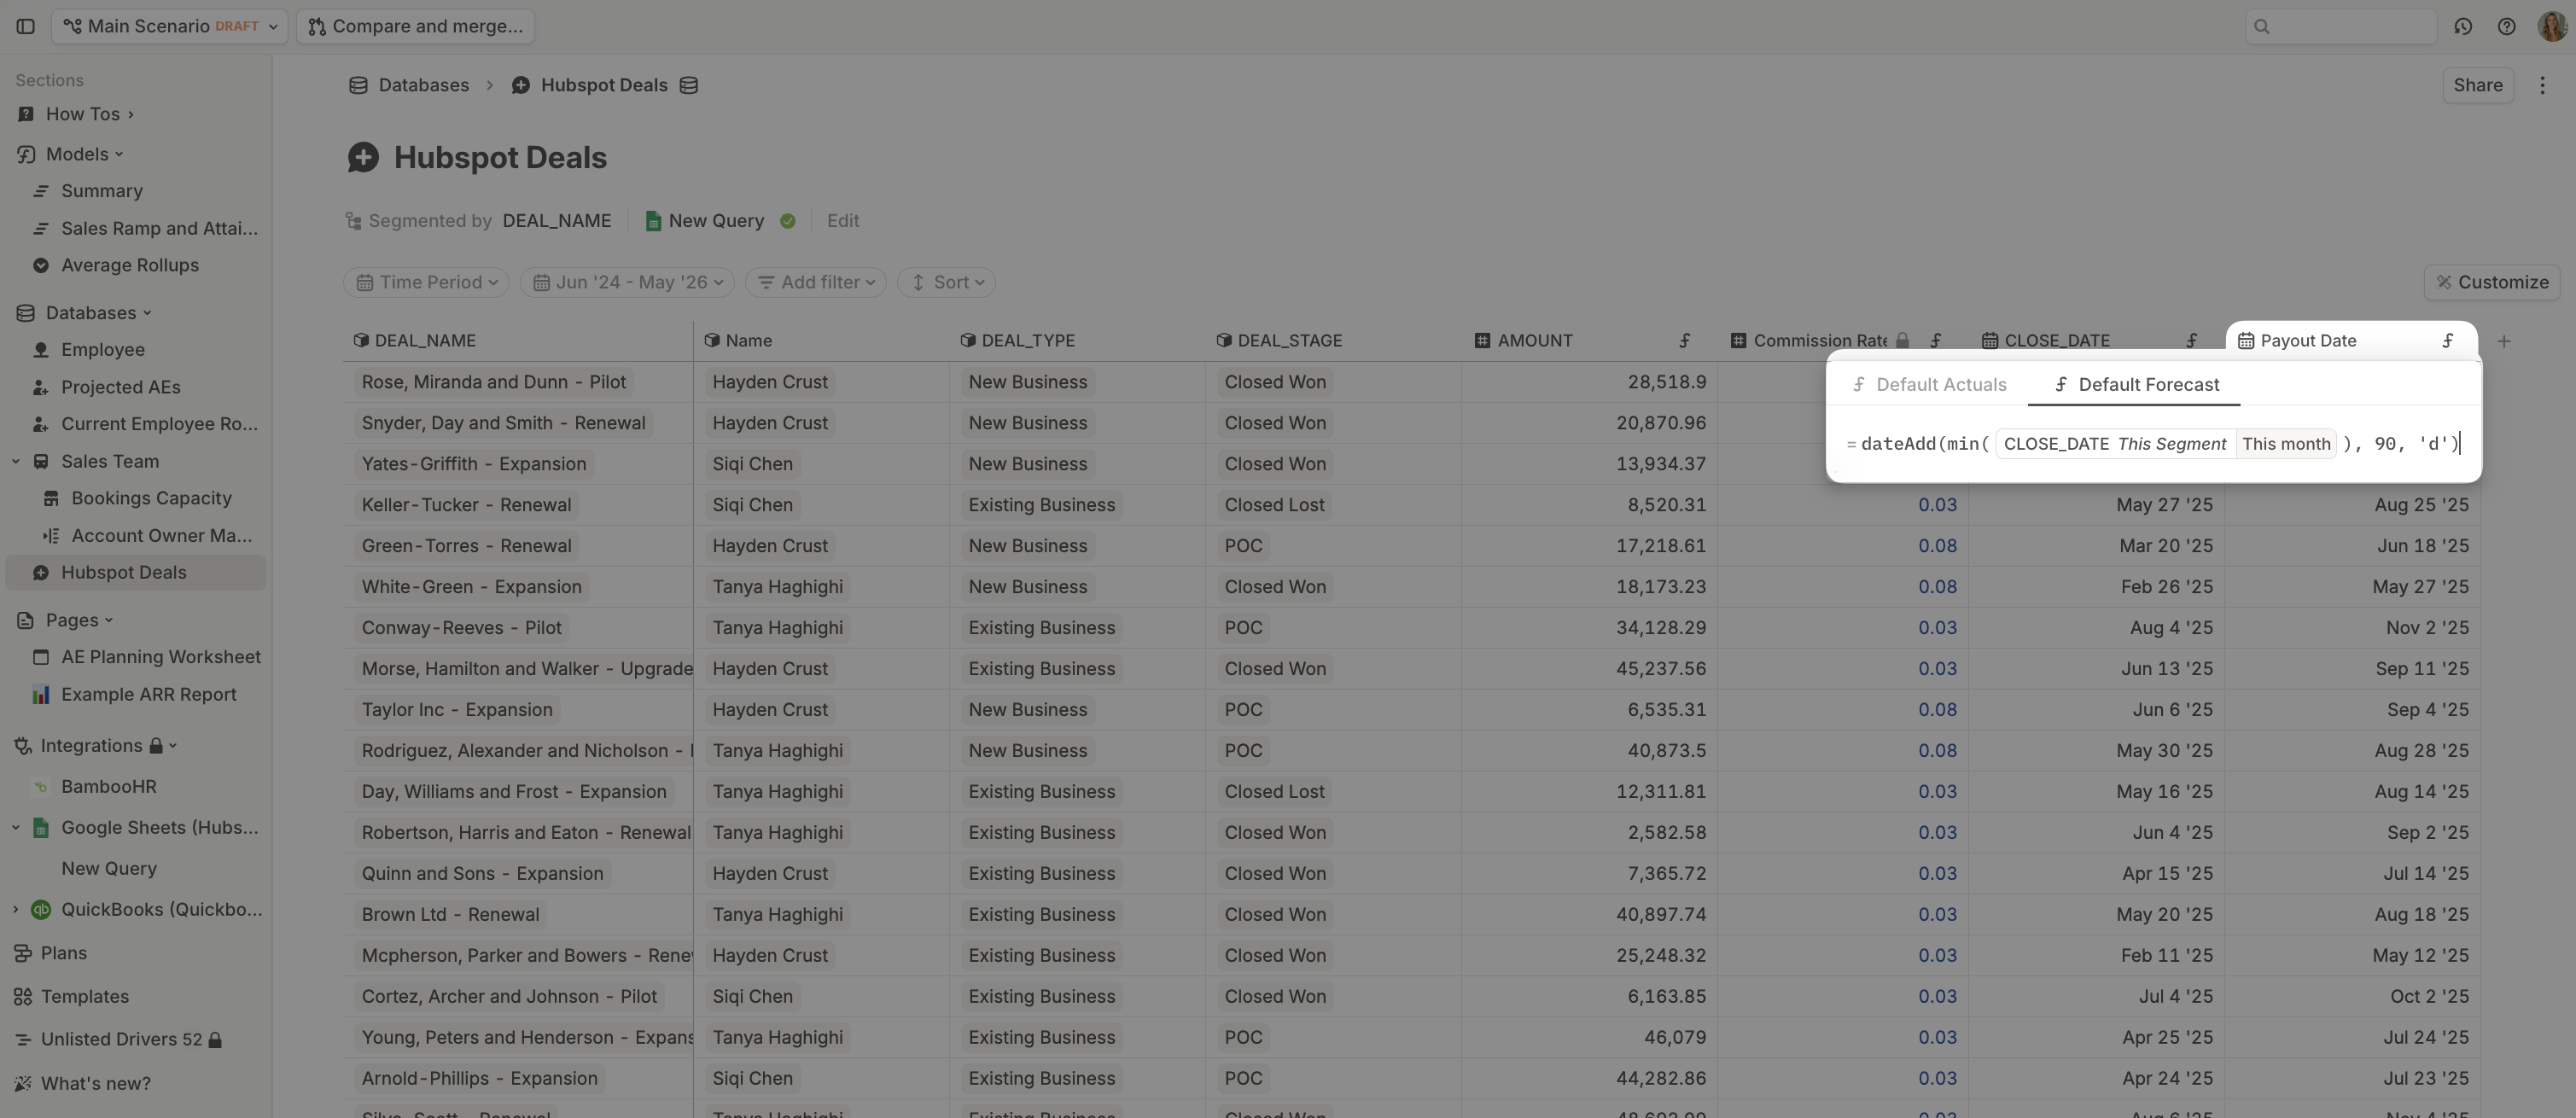
Create a new date driver in your **Deals** database called **Payout Date**. Use `dateAdd()` to add your delay to the deal’s close date. In this example, we assume a 90-day delay.
Since commissions data is part of compensation, many model owners choose to anonymize commission rates and payouts. To do so, right-click the driver column header and toggle **Anonymize data**. You can read more about anonymizing data [here](/guides/sharing/data-anonymization).
## Step 3: Add payout timing logic
In many organizations, commission payouts are deferred until a contract has been active for a set period.
Create a new date driver in your **Deals** database called **Payout Date**. Use `dateAdd()` to add your delay to the deal’s close date. In this example, we assume a 90-day delay.
 ## Step 4: Calculate commissions paid
In your **Deals** database, add a number driver called **Commissions Paid**. Set its formula to multiply **Commission Rate** by the closed-won deal amount from the same deal row, then use **Payout Date** as the timing so the payout lands in the month calculated in Step 3.
For example, if your closed-won deal amount driver is called **Closed Won Deal Amount**, the formula should calculate:
```
Commission Rate * Closed Won Deal Amount
```
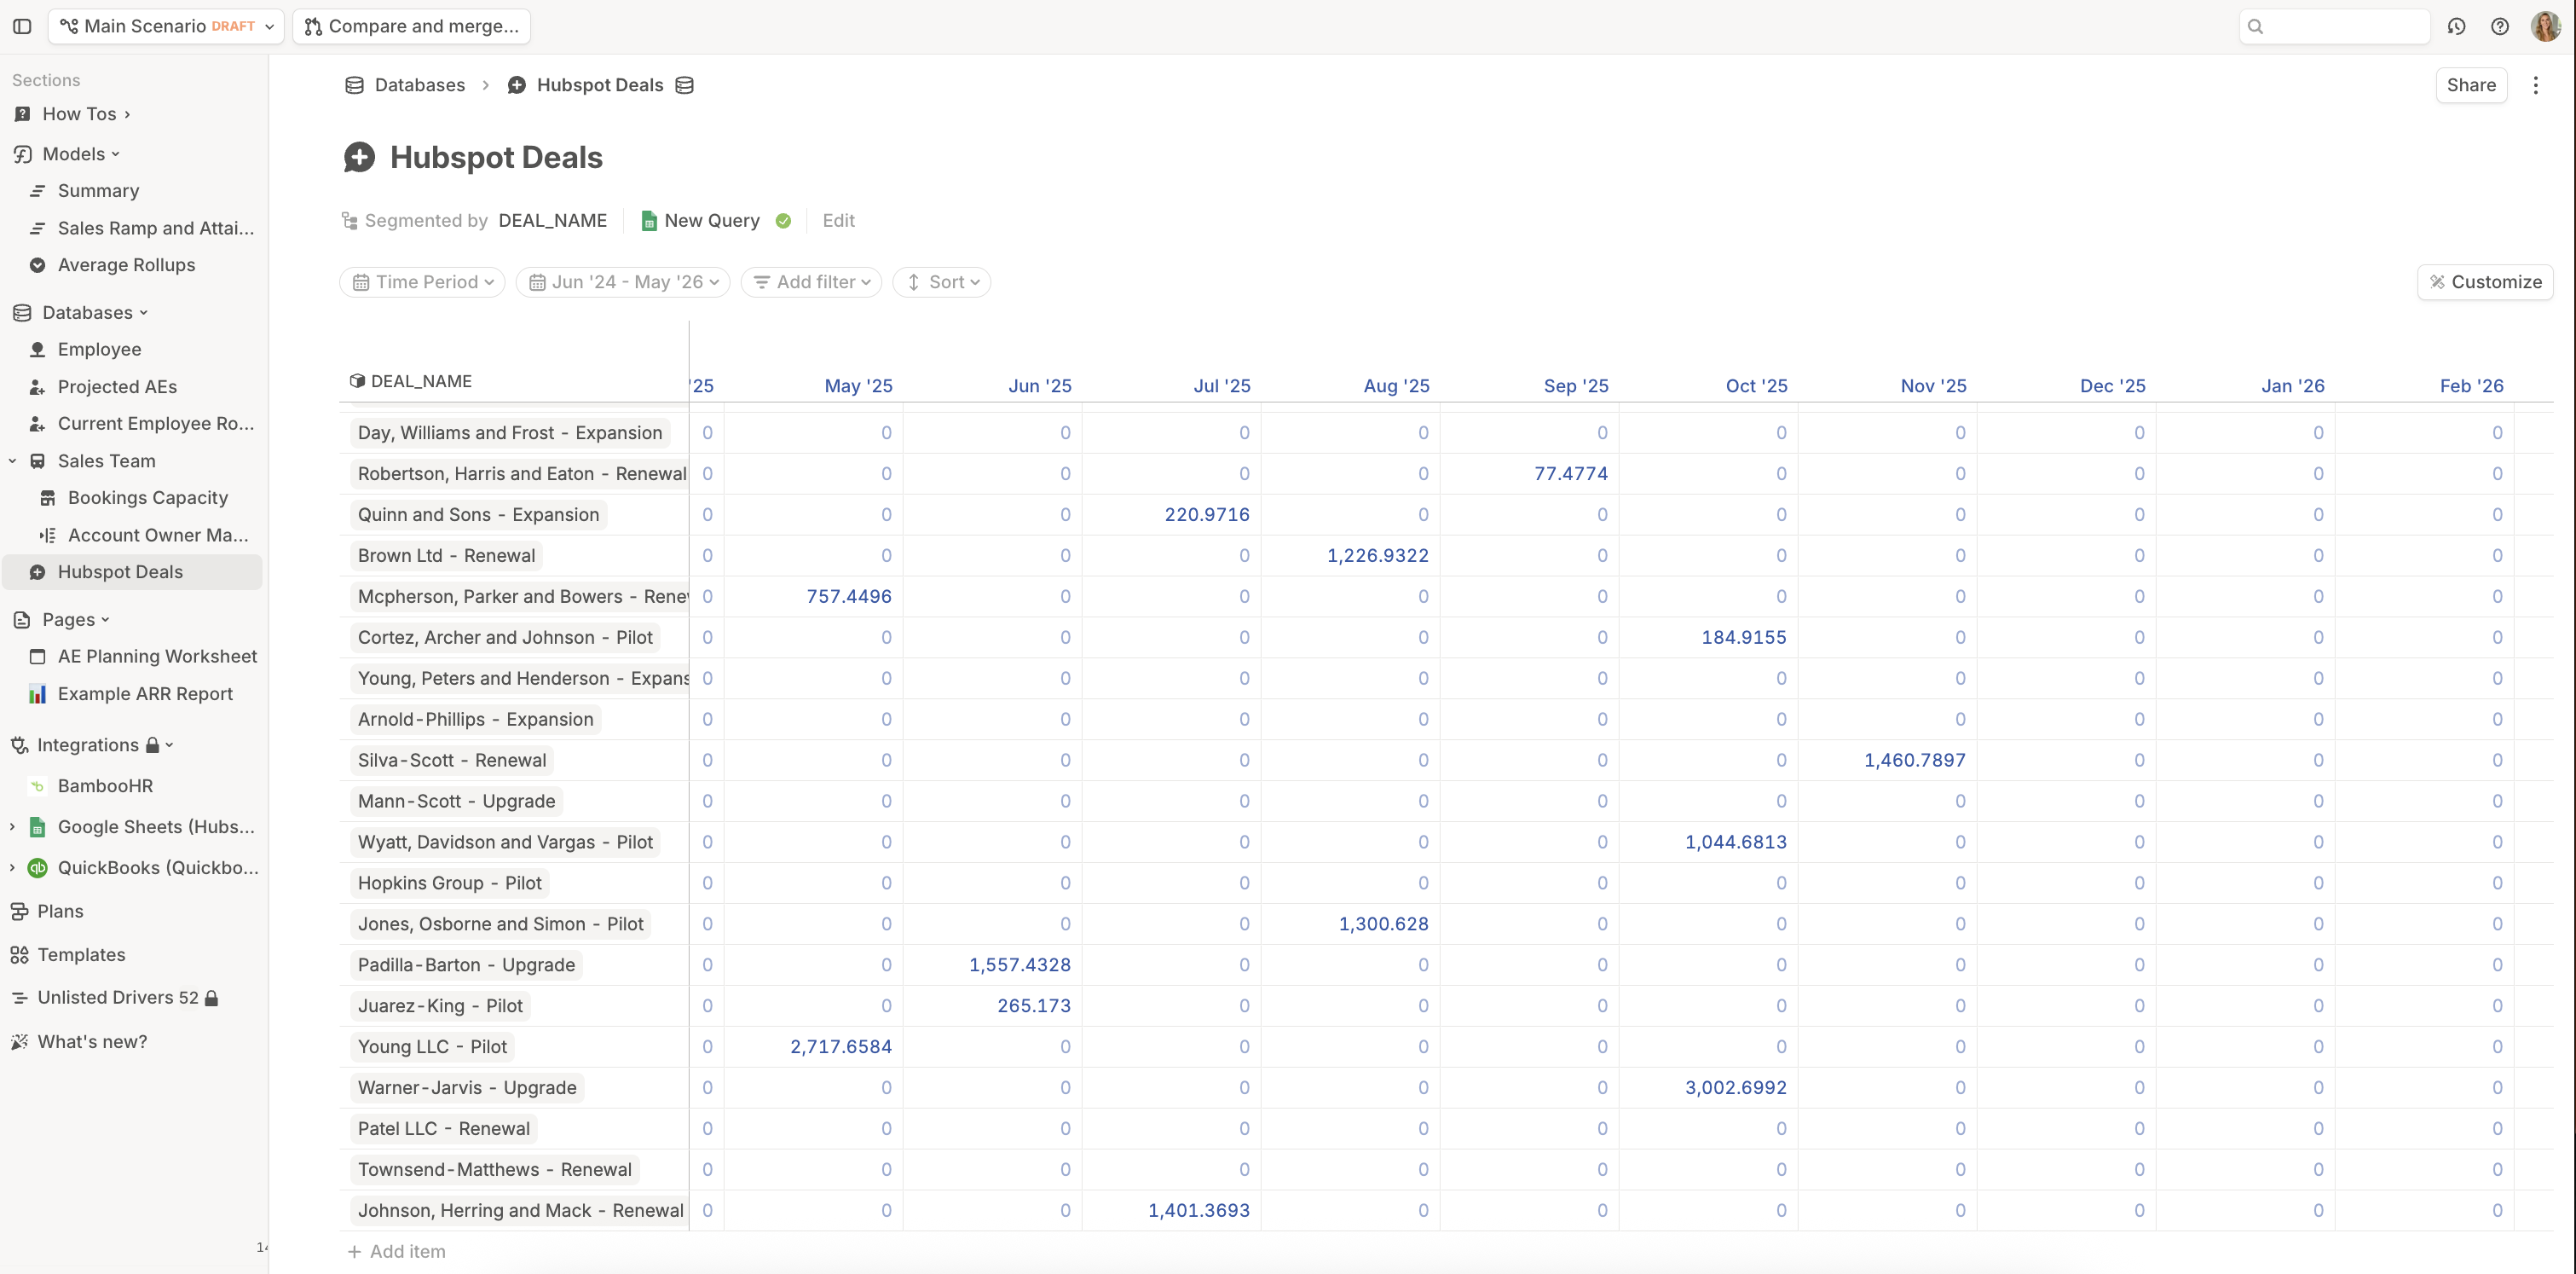
Check the values by clicking the Commissions Paid driver column header and selecting `Show as time series`. This view allows you to check whether the amounts paid land in the correct months.
## Step 4: Calculate commissions paid
In your **Deals** database, add a number driver called **Commissions Paid**. Set its formula to multiply **Commission Rate** by the closed-won deal amount from the same deal row, then use **Payout Date** as the timing so the payout lands in the month calculated in Step 3.
For example, if your closed-won deal amount driver is called **Closed Won Deal Amount**, the formula should calculate:
```
Commission Rate * Closed Won Deal Amount
```
Check the values by clicking the Commissions Paid driver column header and selecting `Show as time series`. This view allows you to check whether the amounts paid land in the correct months.
 ## Step 5: Aggregate commissions by AE
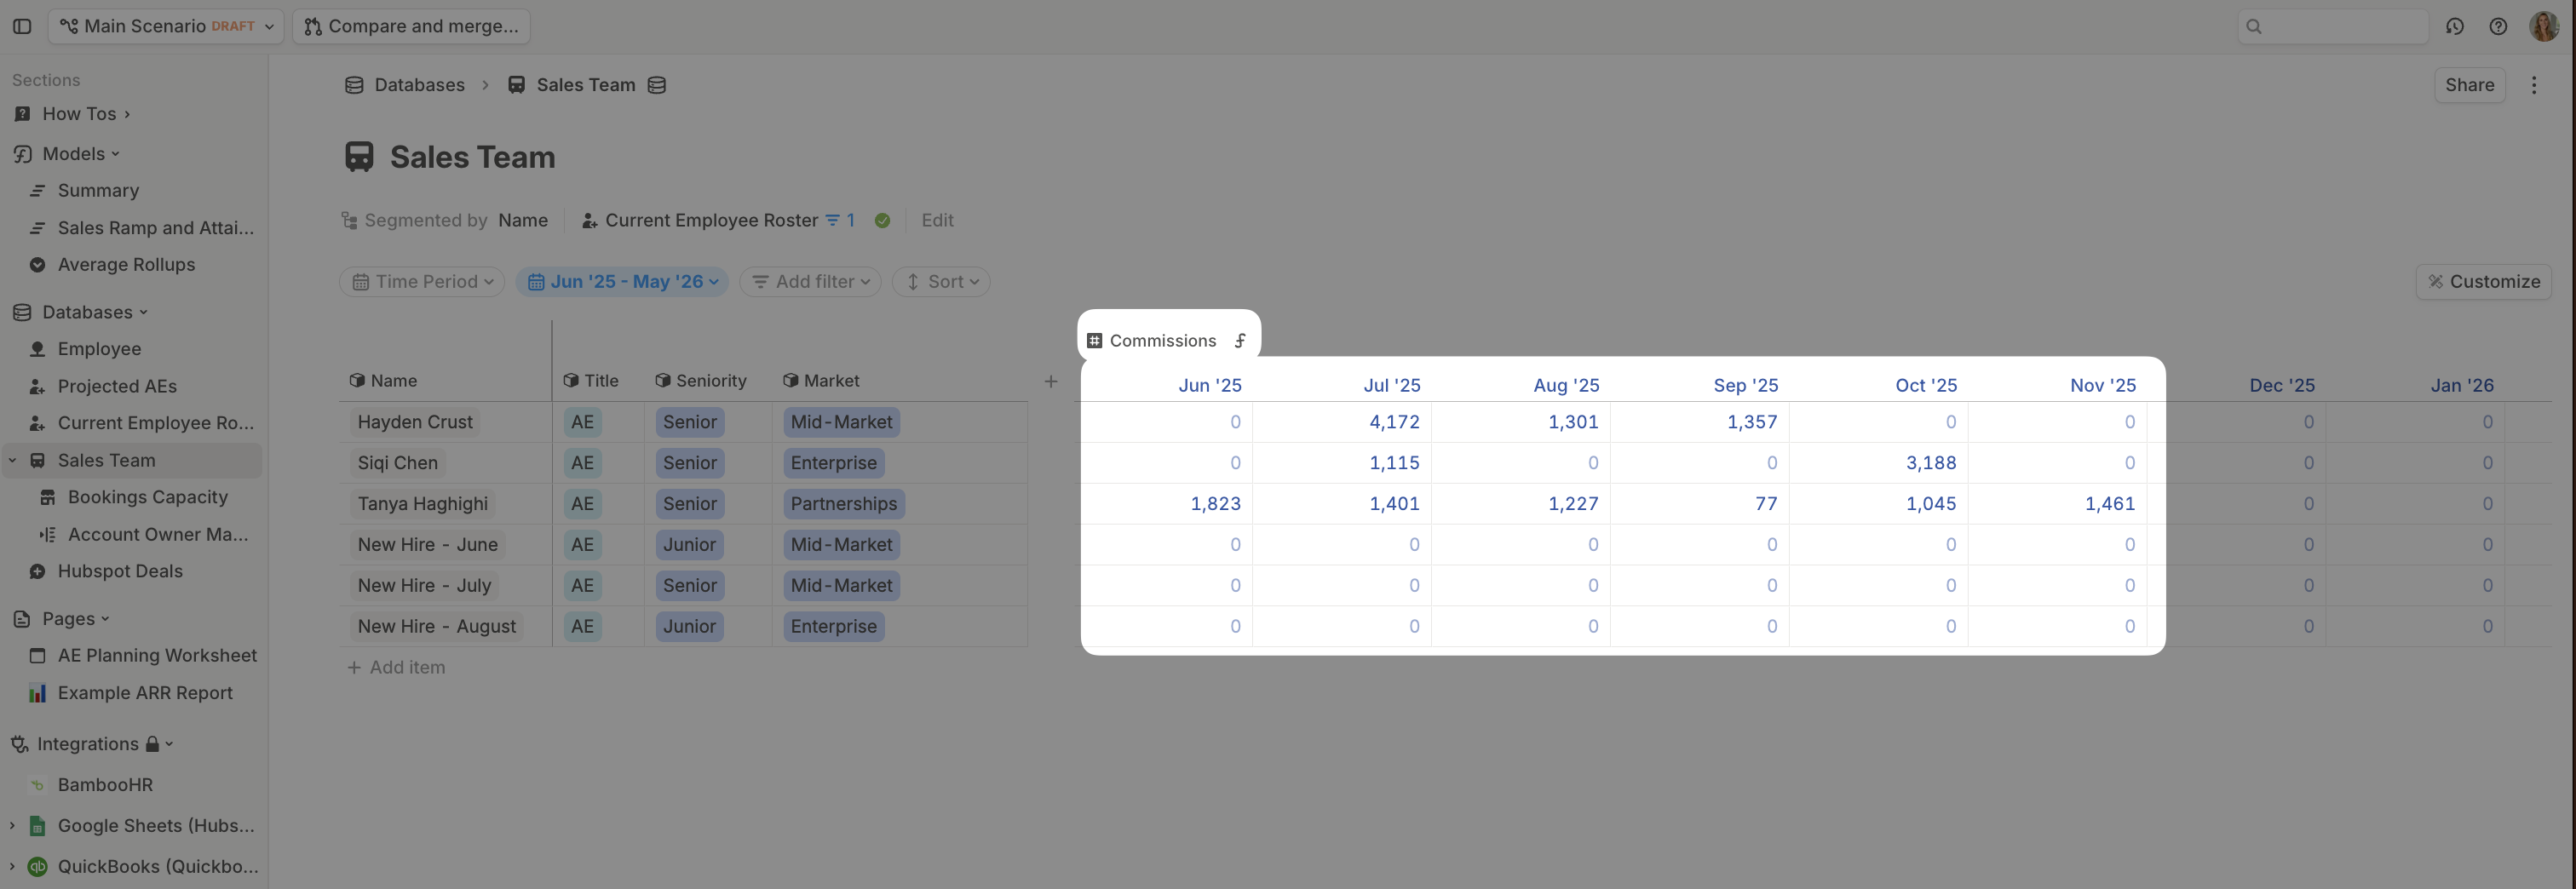
The last step is to aggregate commissions paid by AE.
In your **Sales Team** database, add a number driver for **Commissions**. Set the formula to sum the **Commissions Paid** driver in your **Deals** database where `Name` is `This Name`.
## Step 5: Aggregate commissions by AE
The last step is to aggregate commissions paid by AE.
In your **Sales Team** database, add a number driver for **Commissions**. Set the formula to sum the **Commissions Paid** driver in your **Deals** database where `Name` is `This Name`.
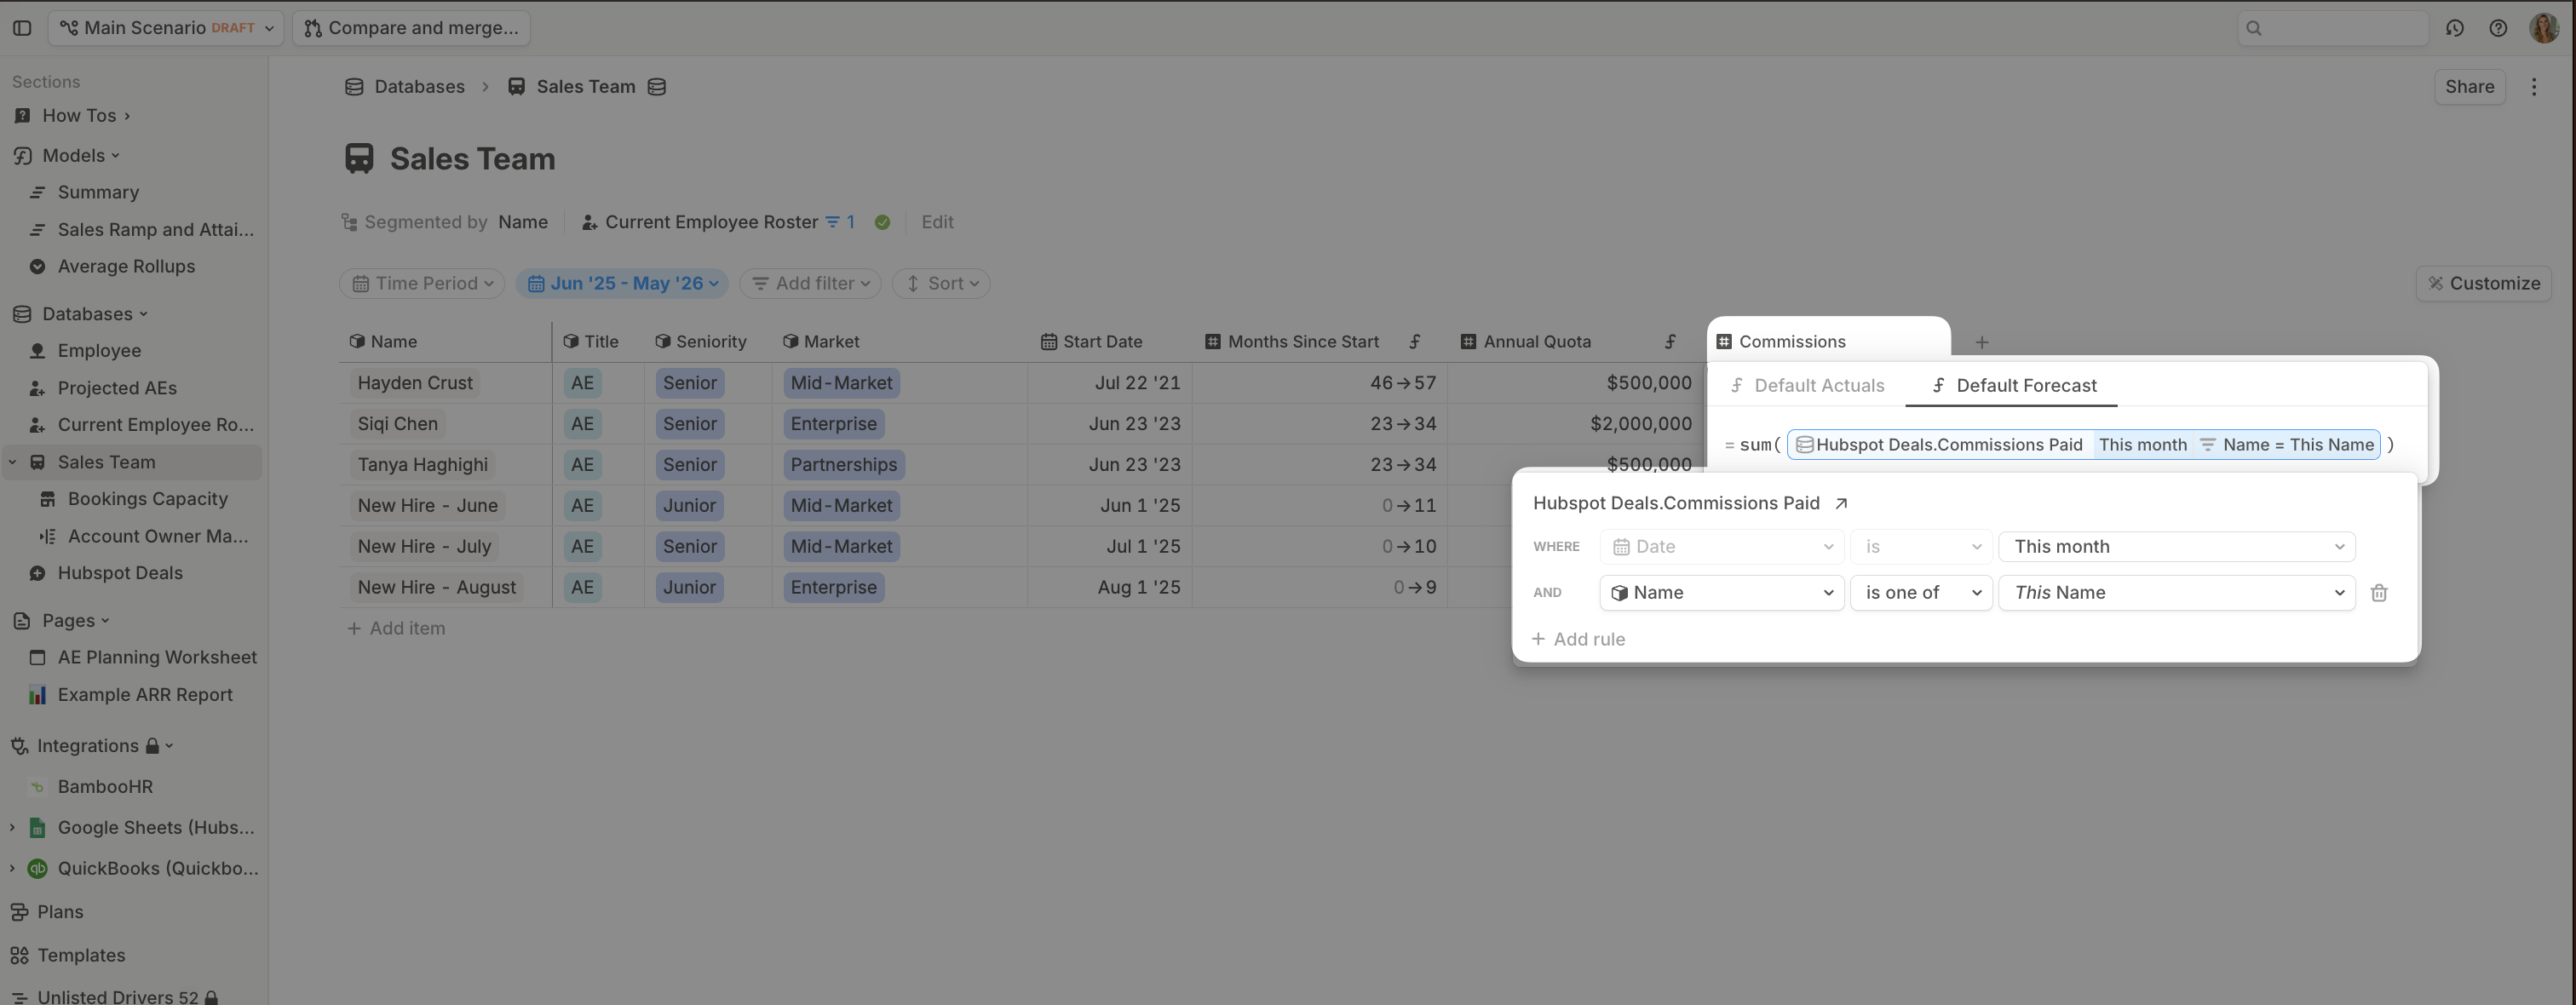 By showing the driver column Commissions as a time series, you can verify the commissions roll up appropriately.