What is a database?
When you connect an integration, your data flows into a database. You can then create additional databases that pull from this original database and aggregate the data at different levels. For example, if you import GL data with vendor-level details from QuickBooks, NetSuite, or Xero into a database, you can build another database that pulls from it and aggregates the data by department or class.Creating a database
The most common way to create a database is by clicking the + button next to a section or page in the sidebar. The new database will appear nested under that section or page. Select Database as the type and give it a clear name, along with an icon or emoji for easy identification.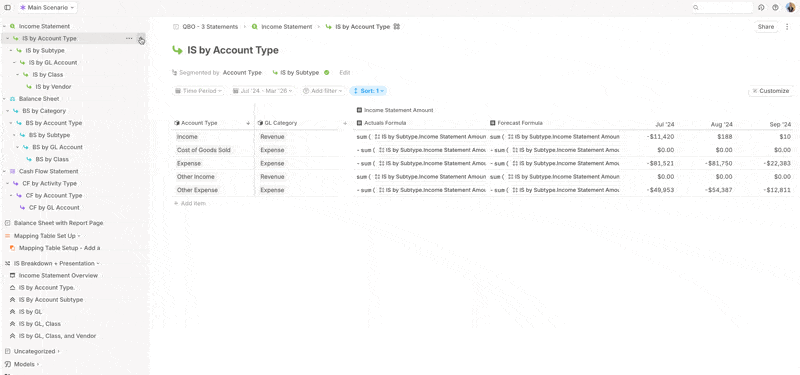
Configuring a database
After creating a database, the next step is to configure it.- Click on the configuration header to expand it.
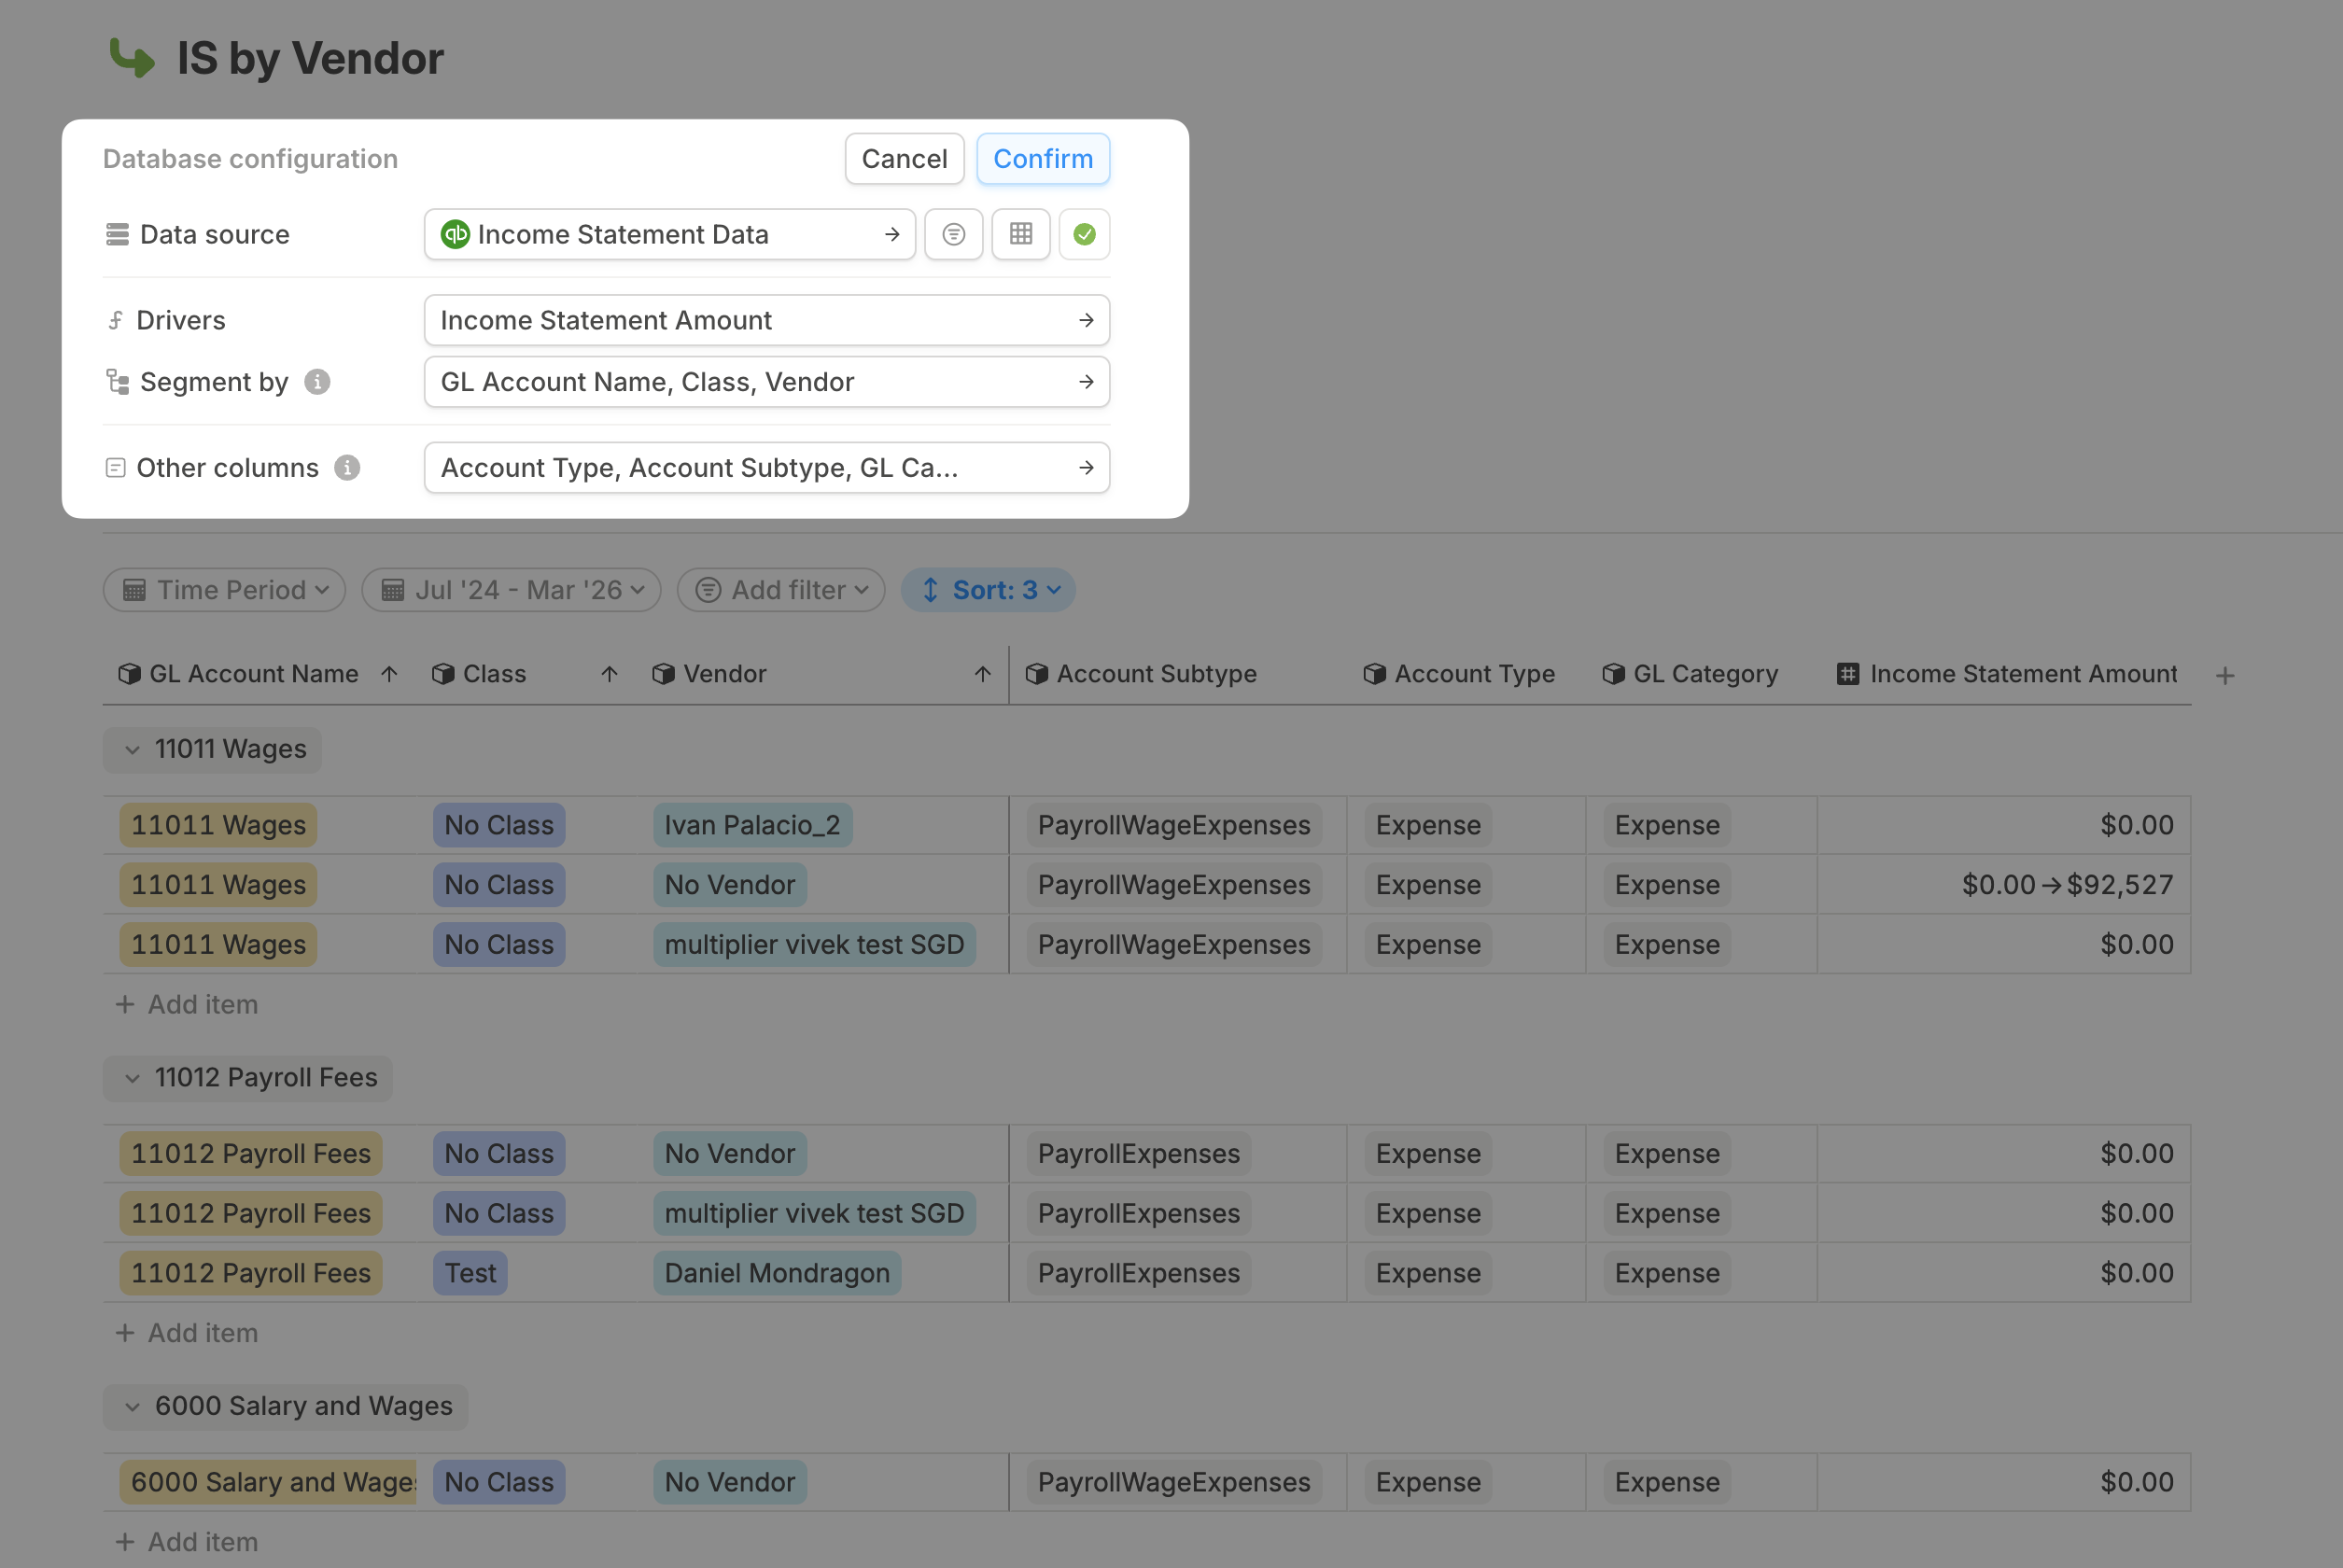
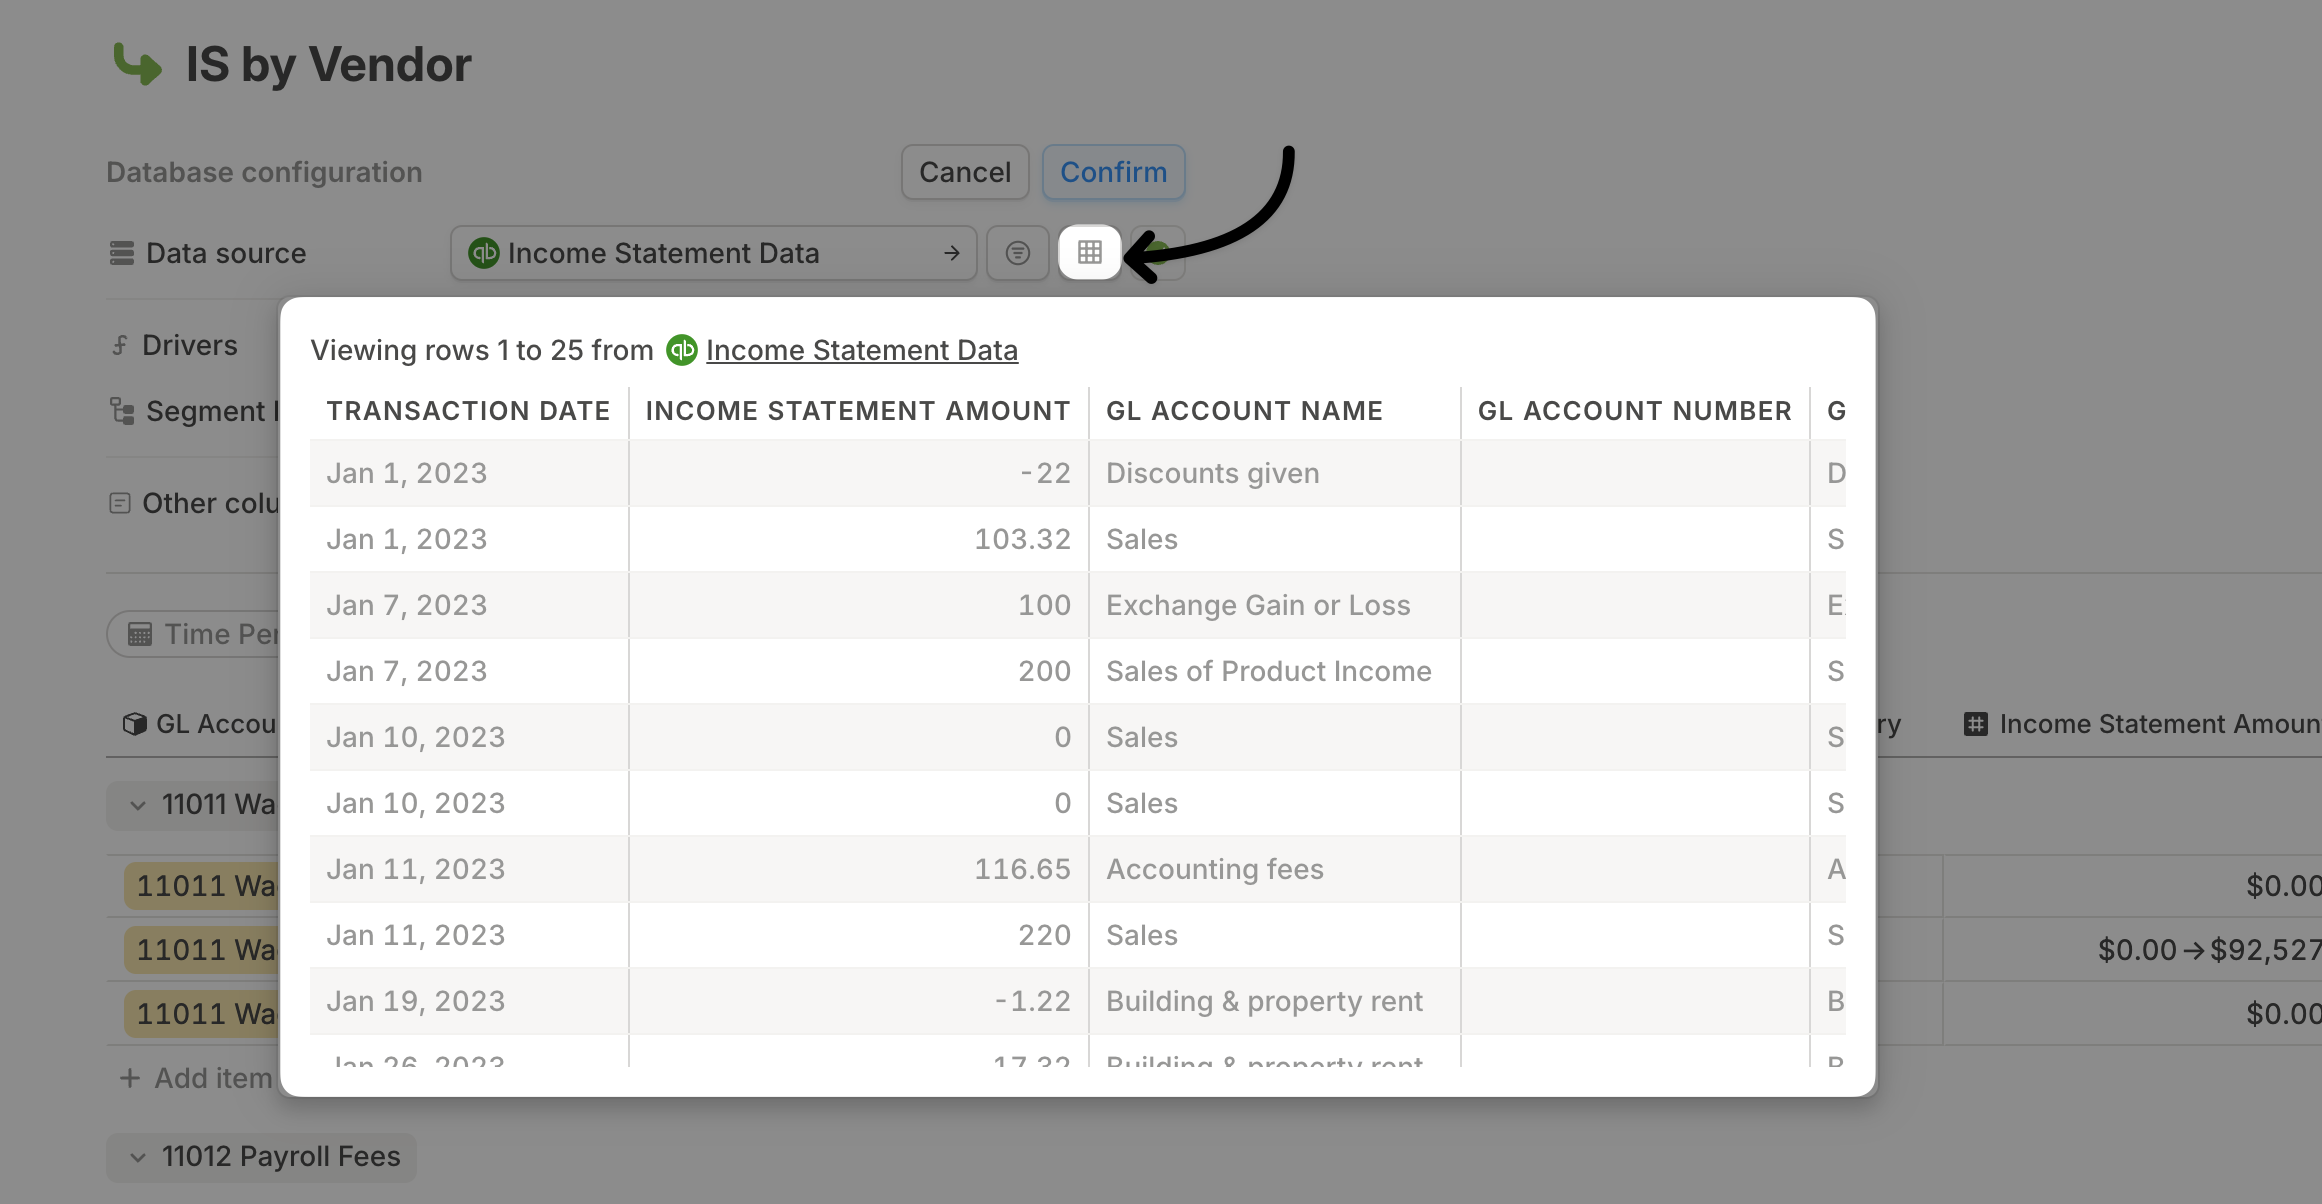
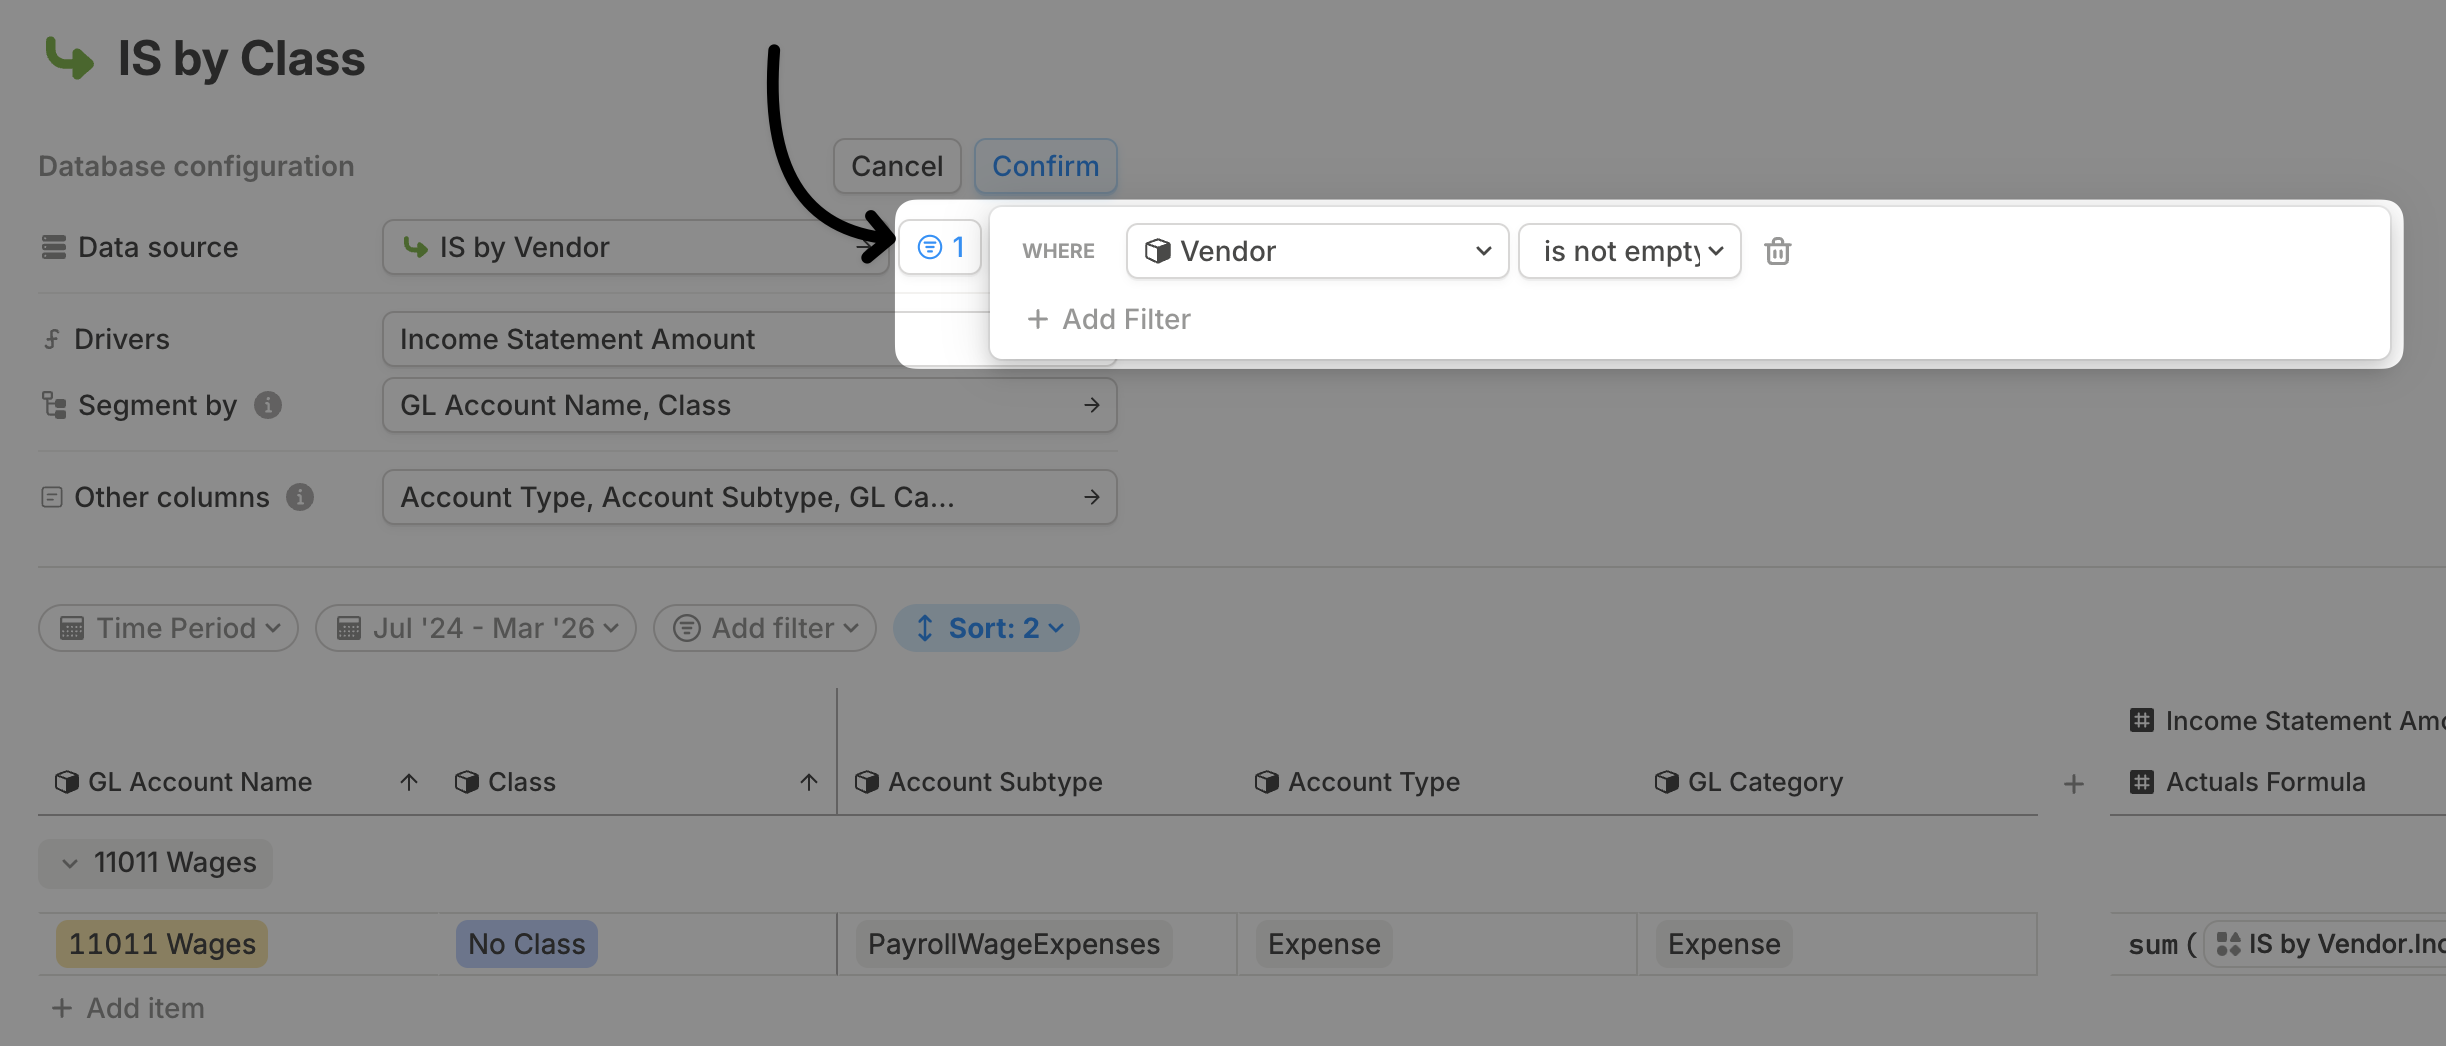
- Select the data source—this can be an existing integration query or another database you’ve already created.
- Choose the drivers you want to track. These are key metrics or dates you’d like to view as a time series.
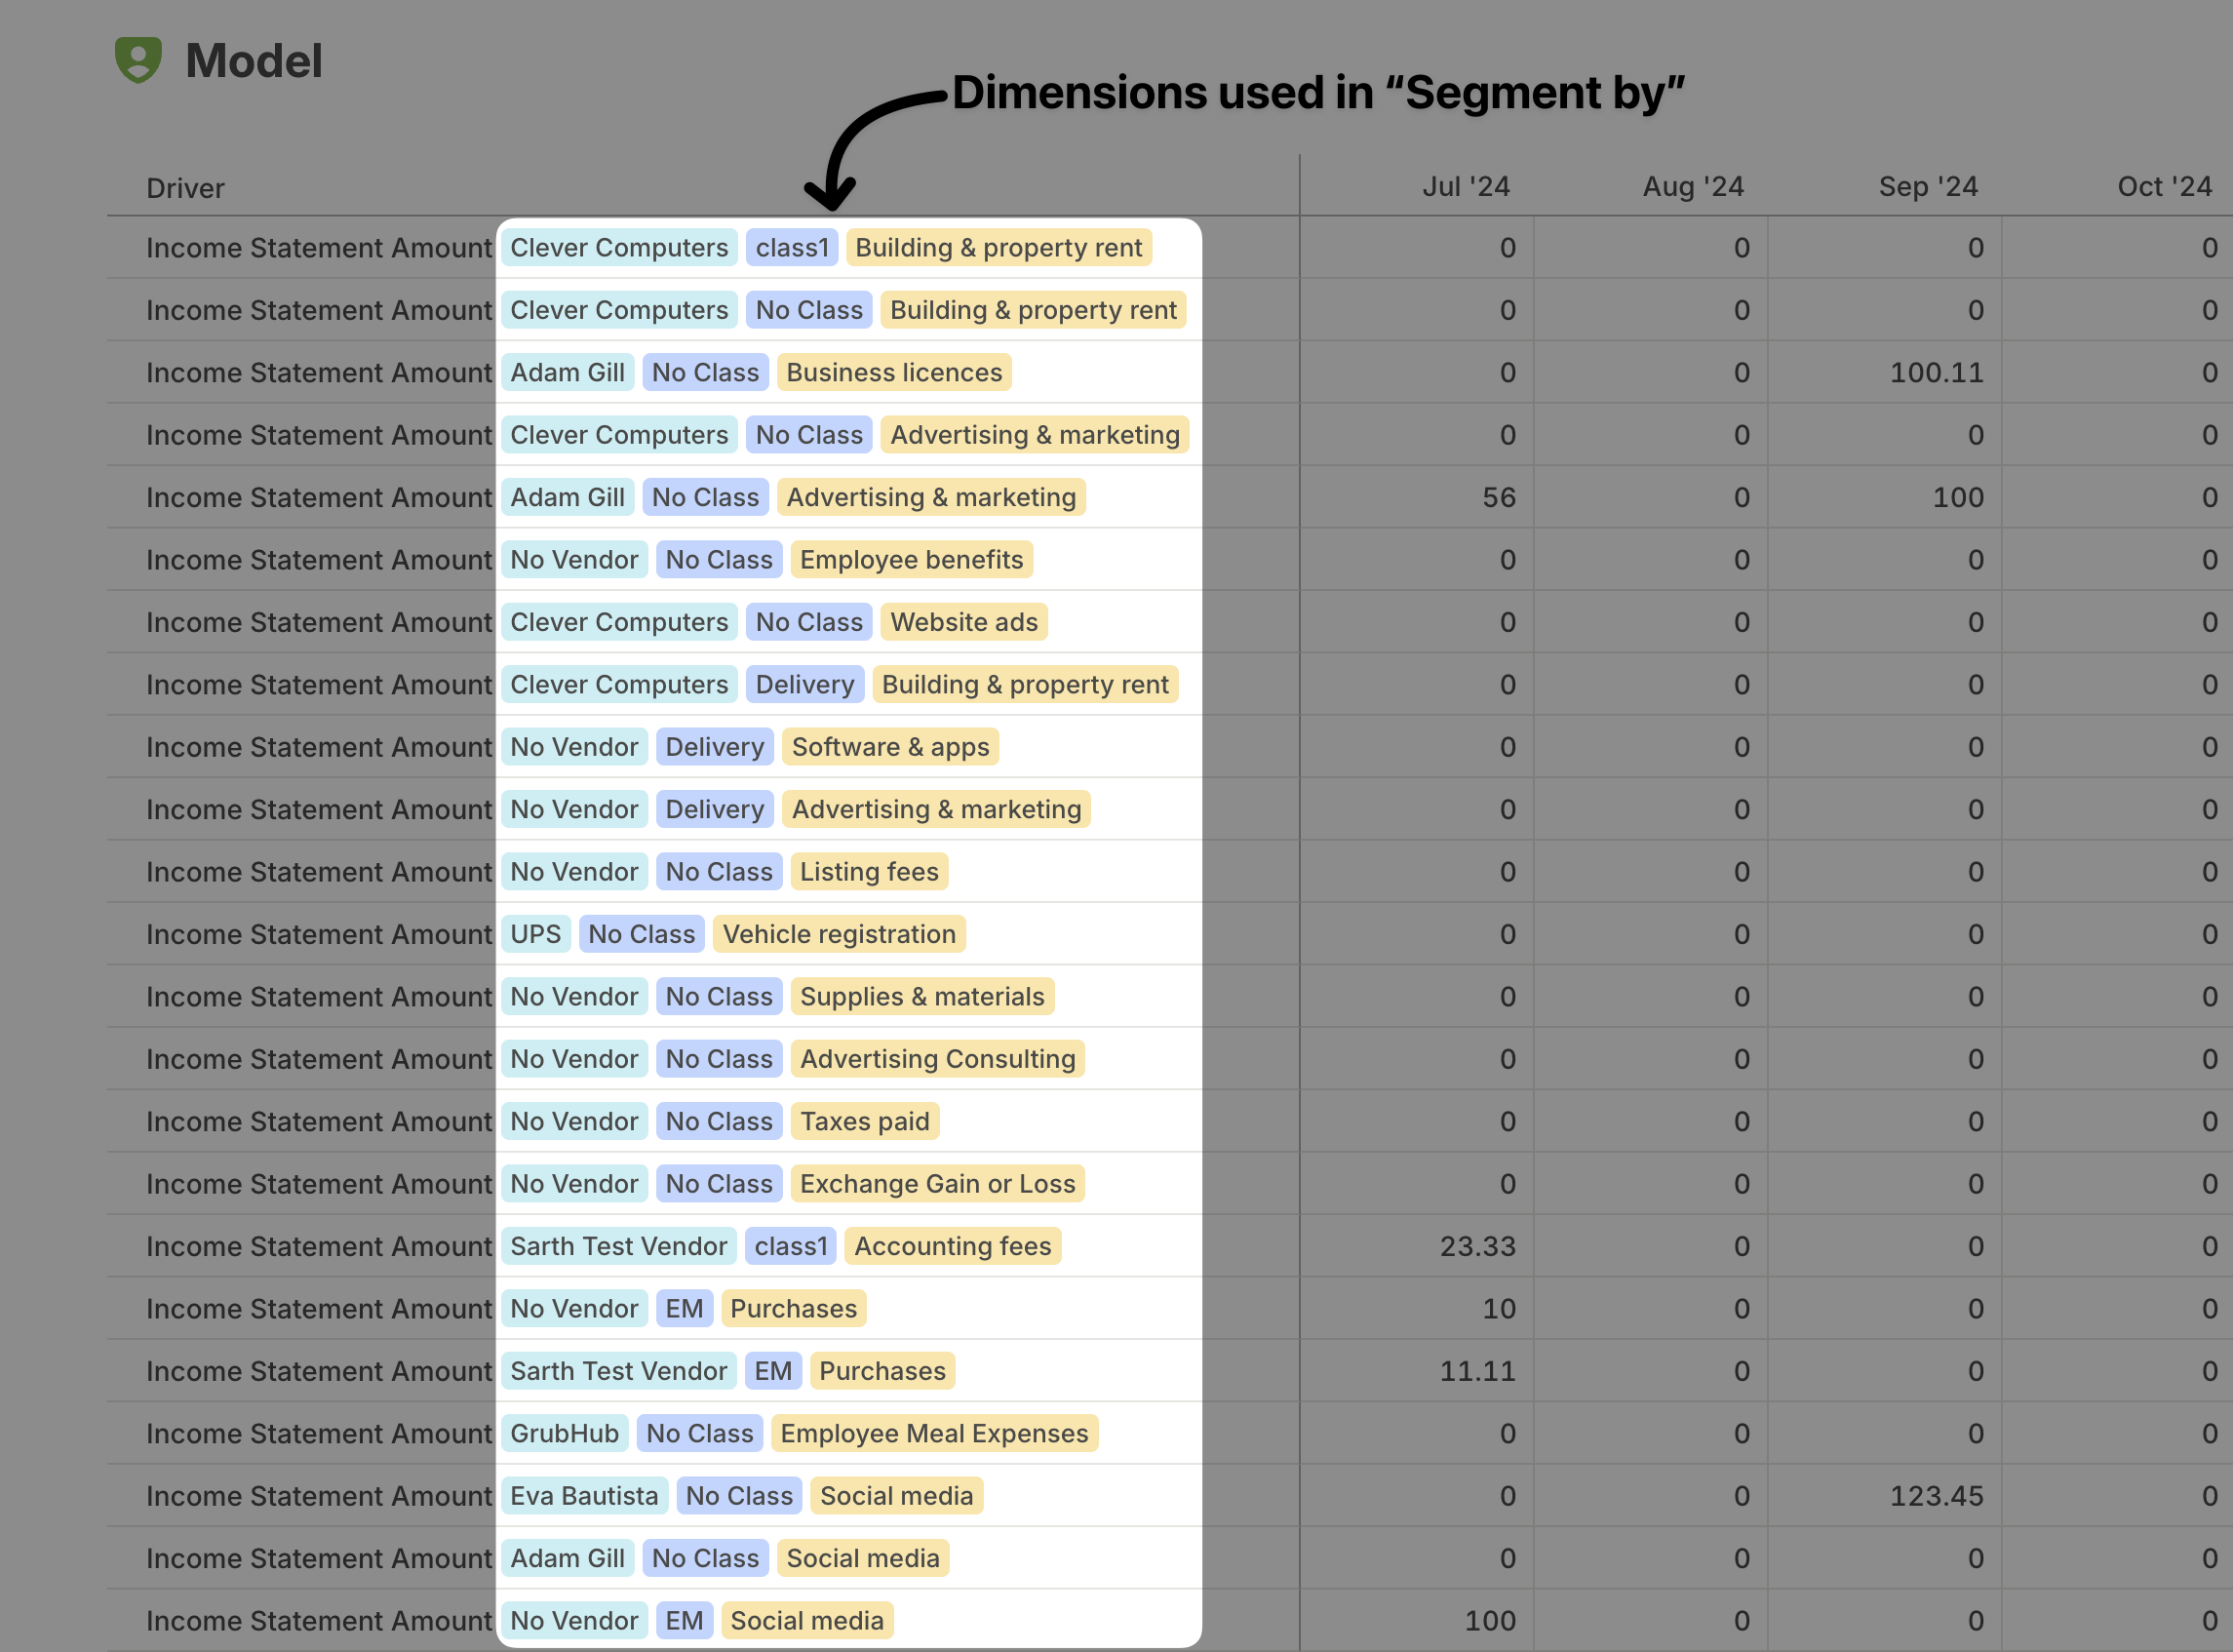
- Select the dimensions to segment your data. Segmentation determines the granularity of your database.
- Add any extra dimensions from your data source that isn’t used for segmentation under Other columns.
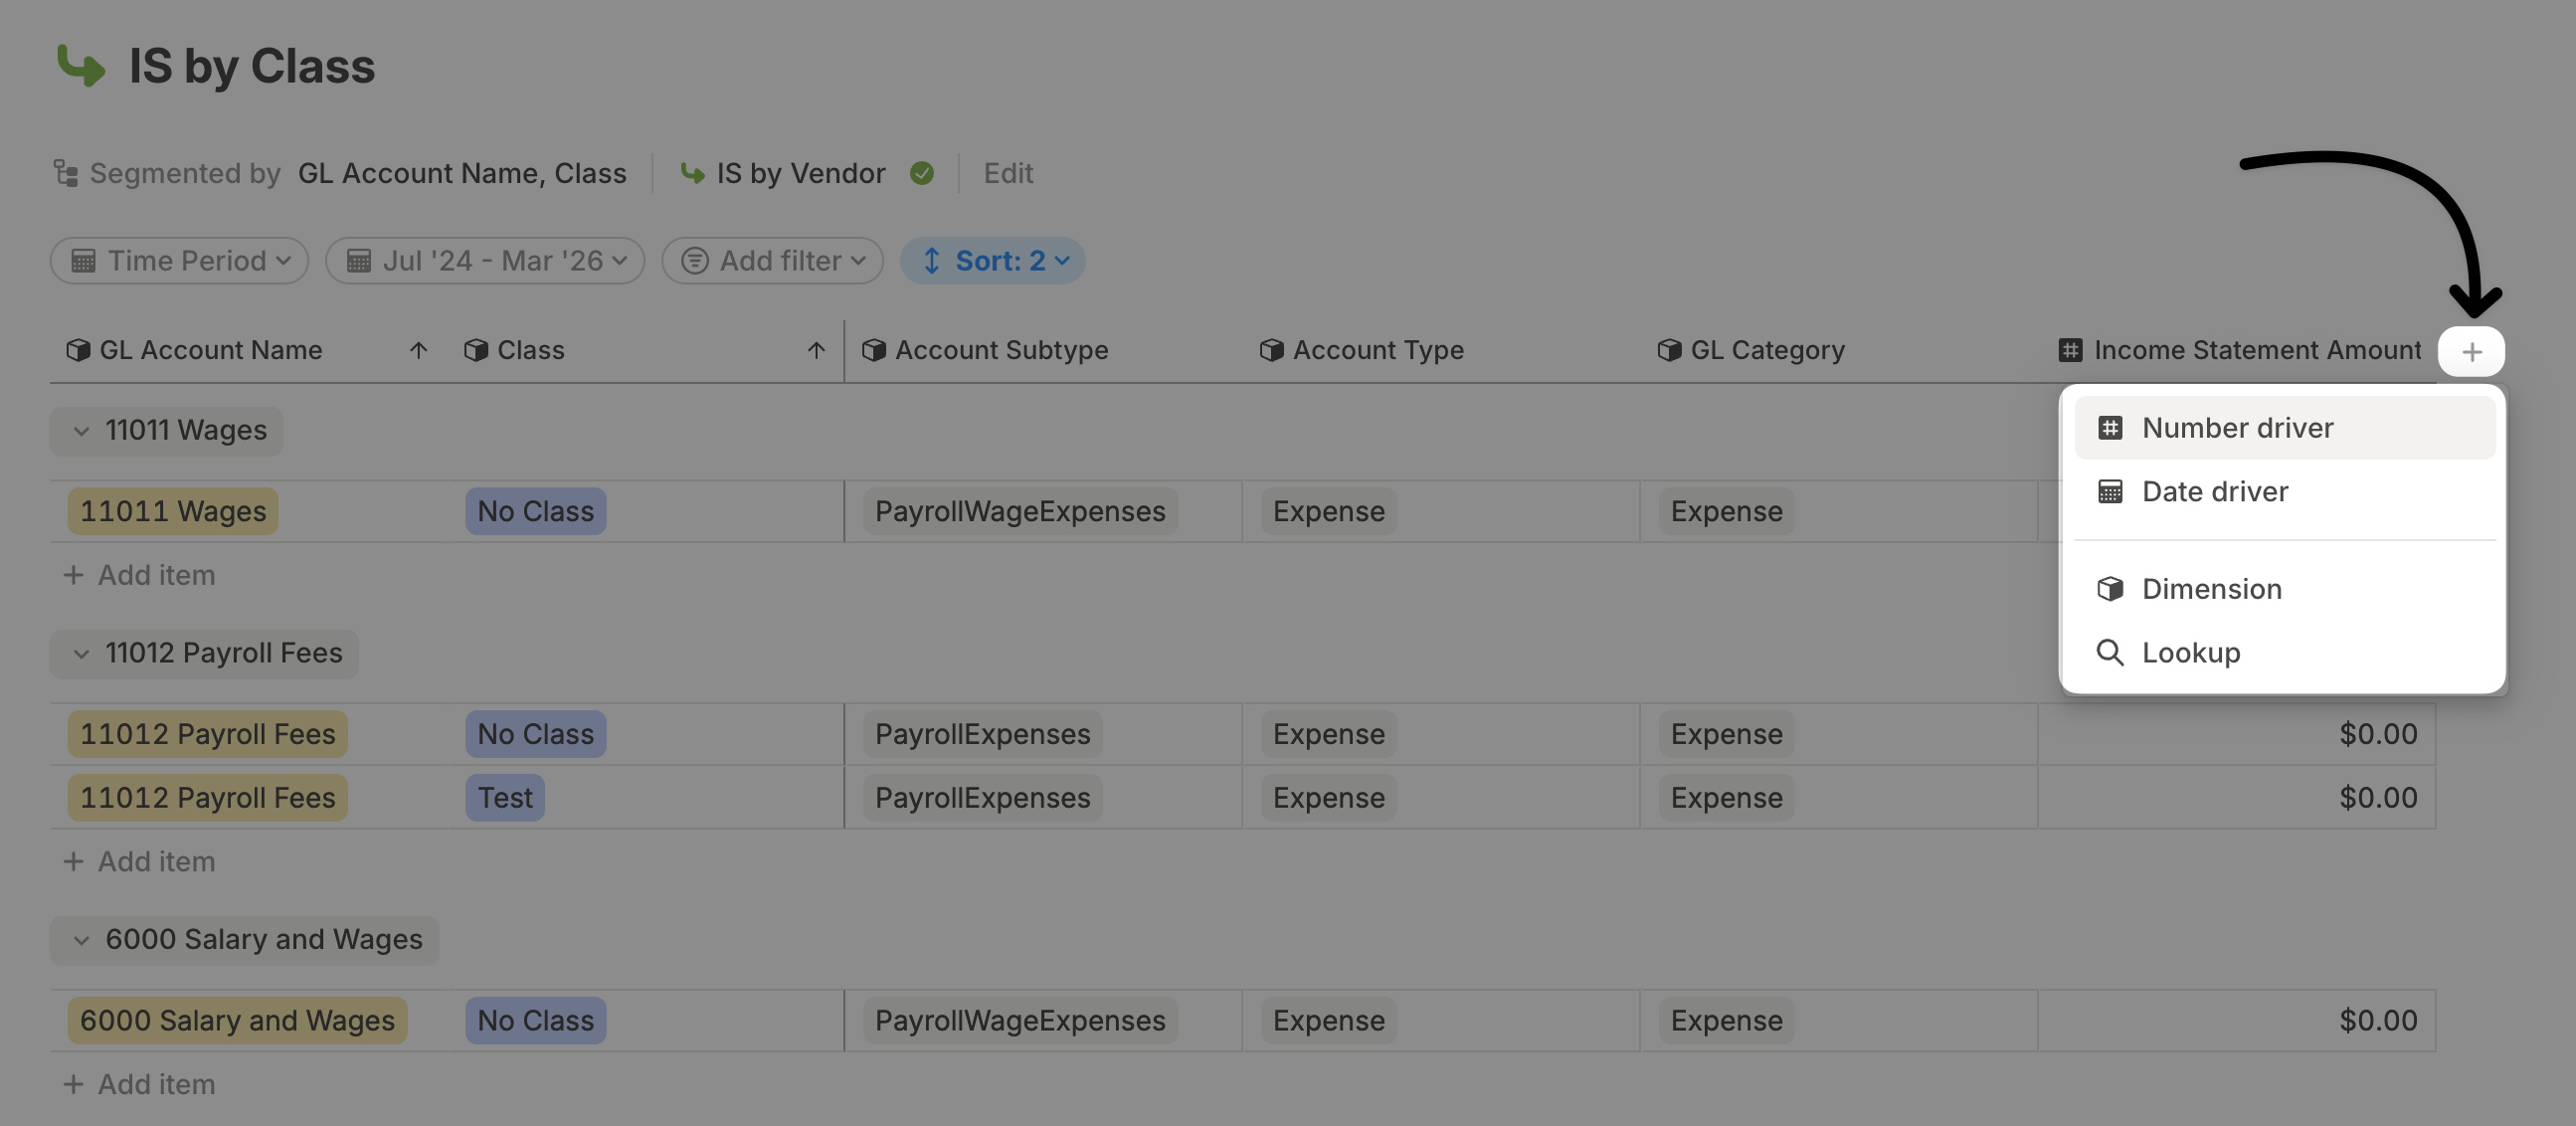
Adding a column
To create a new column, click the + button at the far right of the database. You’ll then see the following options:- Number driver – Use this for calculated values. Drivers store time-series data, meaning the values can vary from month to month, but they don’t have to. Learn more about number drivers here.
- Date driver – Works like a number driver but stores date values instead. Learn more about date drivers here.
- Dimension – A predefined list of values to help categorize your data. Unlike drivers, dimensions do not change over time. For example, in a GL database, dimensions could include Vendor, Location, or Department. Learn more about dimensions here.
- Lookup – Automatically populate a dimension based on data from another database, similar to VLOOKUP() in spreadsheets. Learn more about lookups here.
For HRIS databases, the process of adding a column is different. Please follow the steps here.
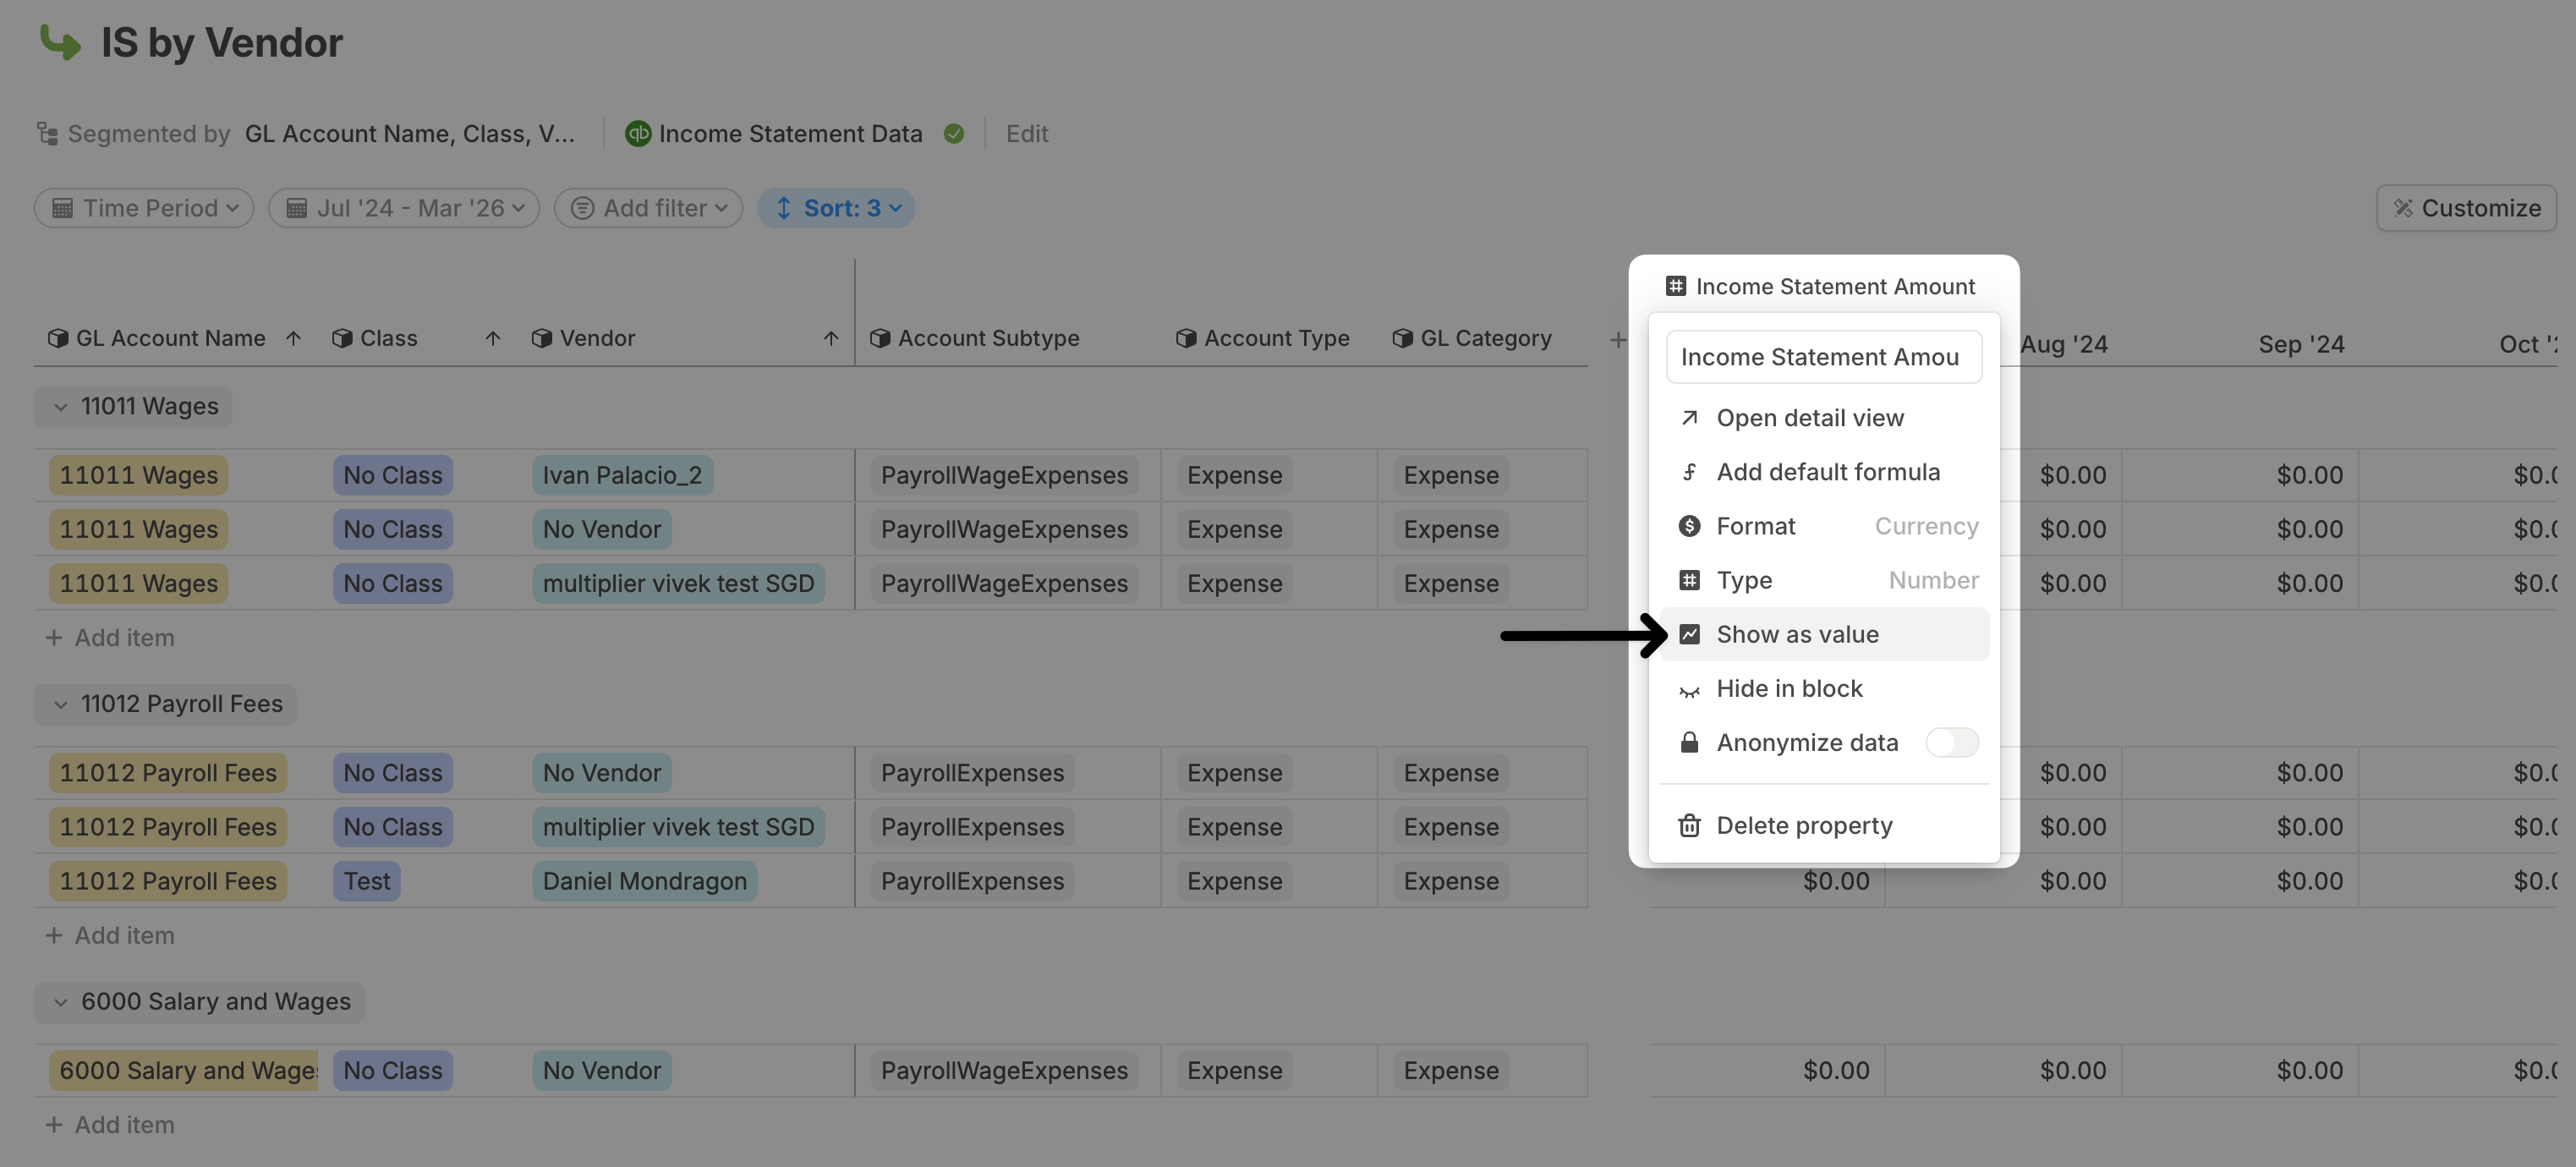
Show a column as timeseries
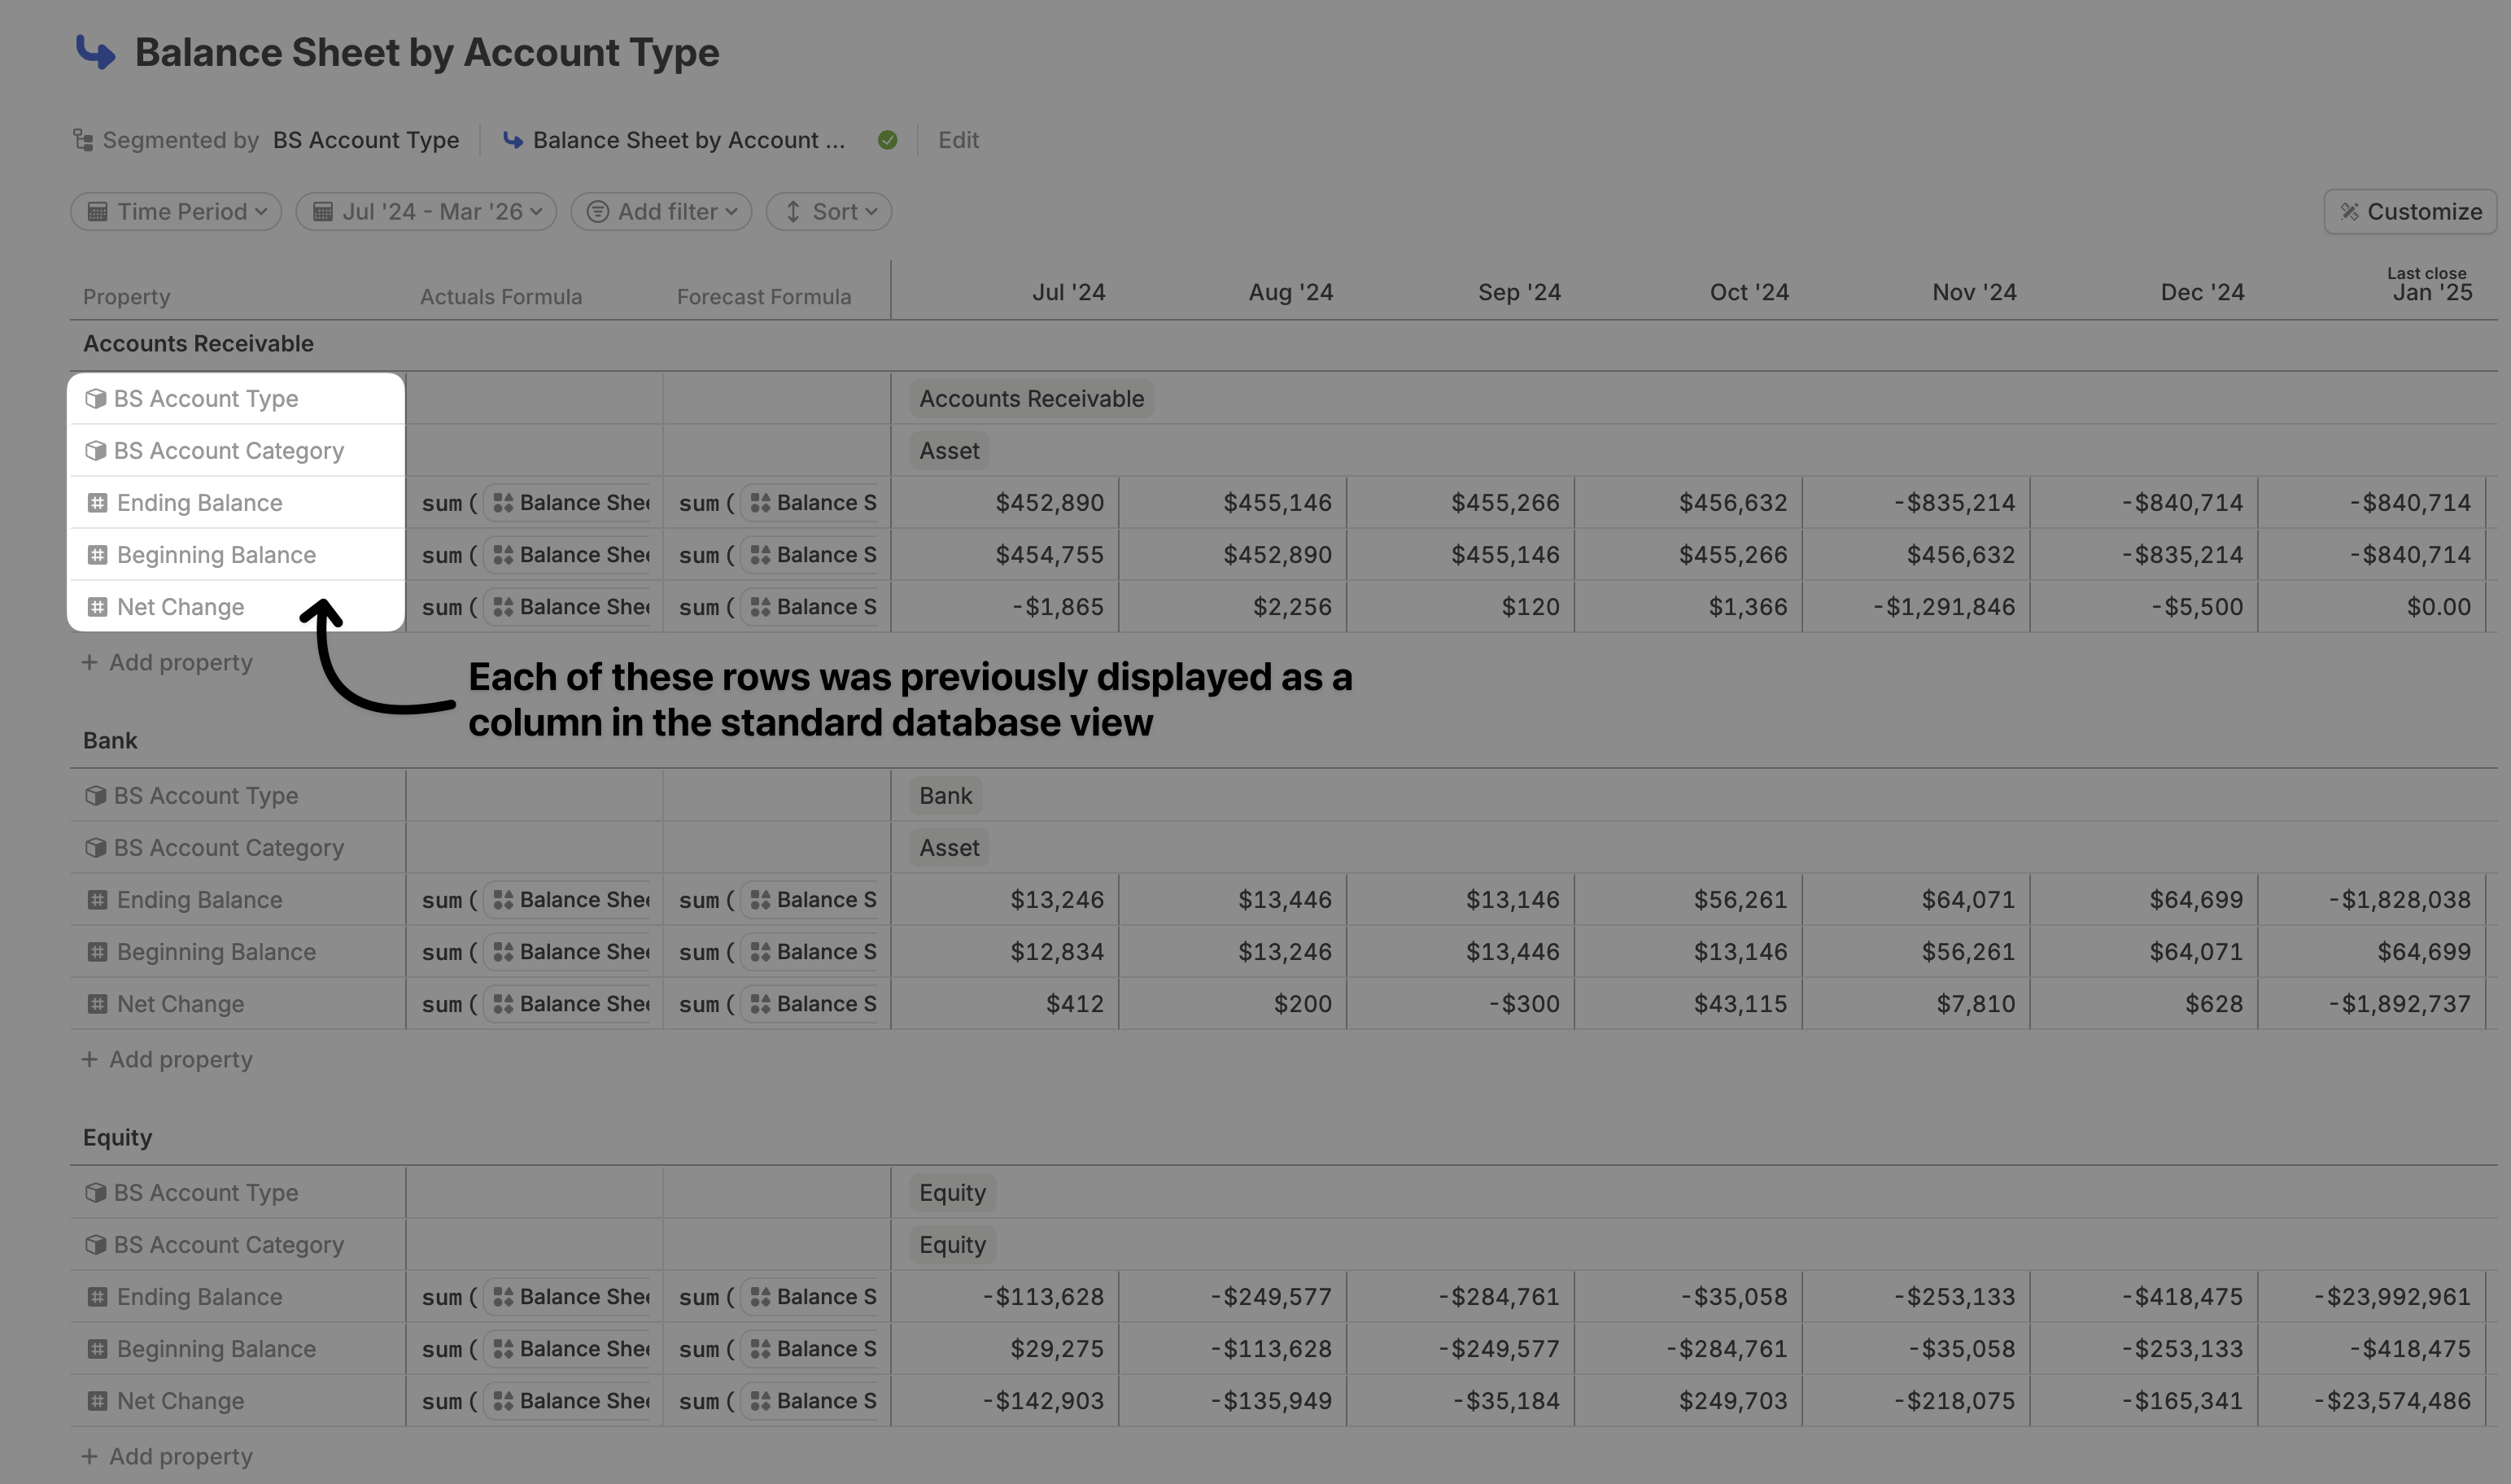
As mentioned earlier, drivers store time-series data, meaning their values can vary from month to month. While we display them as a single column in the database for readability, each driver column can be expanded to access its time-series data. To show a driver column as a time series, click on its name in the database header and select Show as time series. The column will expand and appear on the far right of the database after all other columns.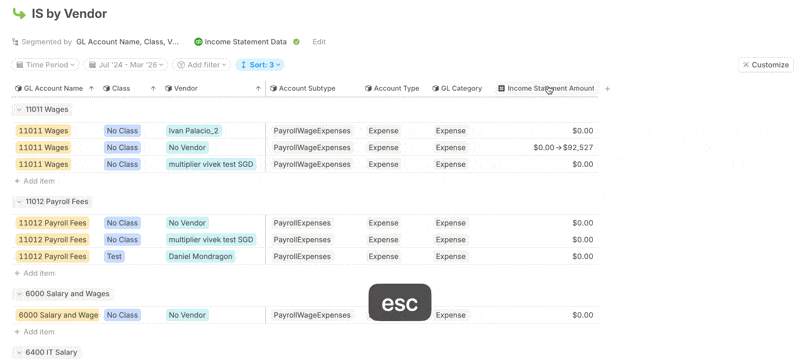
If you choose to display a different driver column as a time series, it will automatically replace the current one, which will revert to being displayed as a value.
Option+Shift+Ato hide or show the Actual Formula column.Option+Shift+Fto hide or show the Forecast Formula column.
Show all columns as timeseries
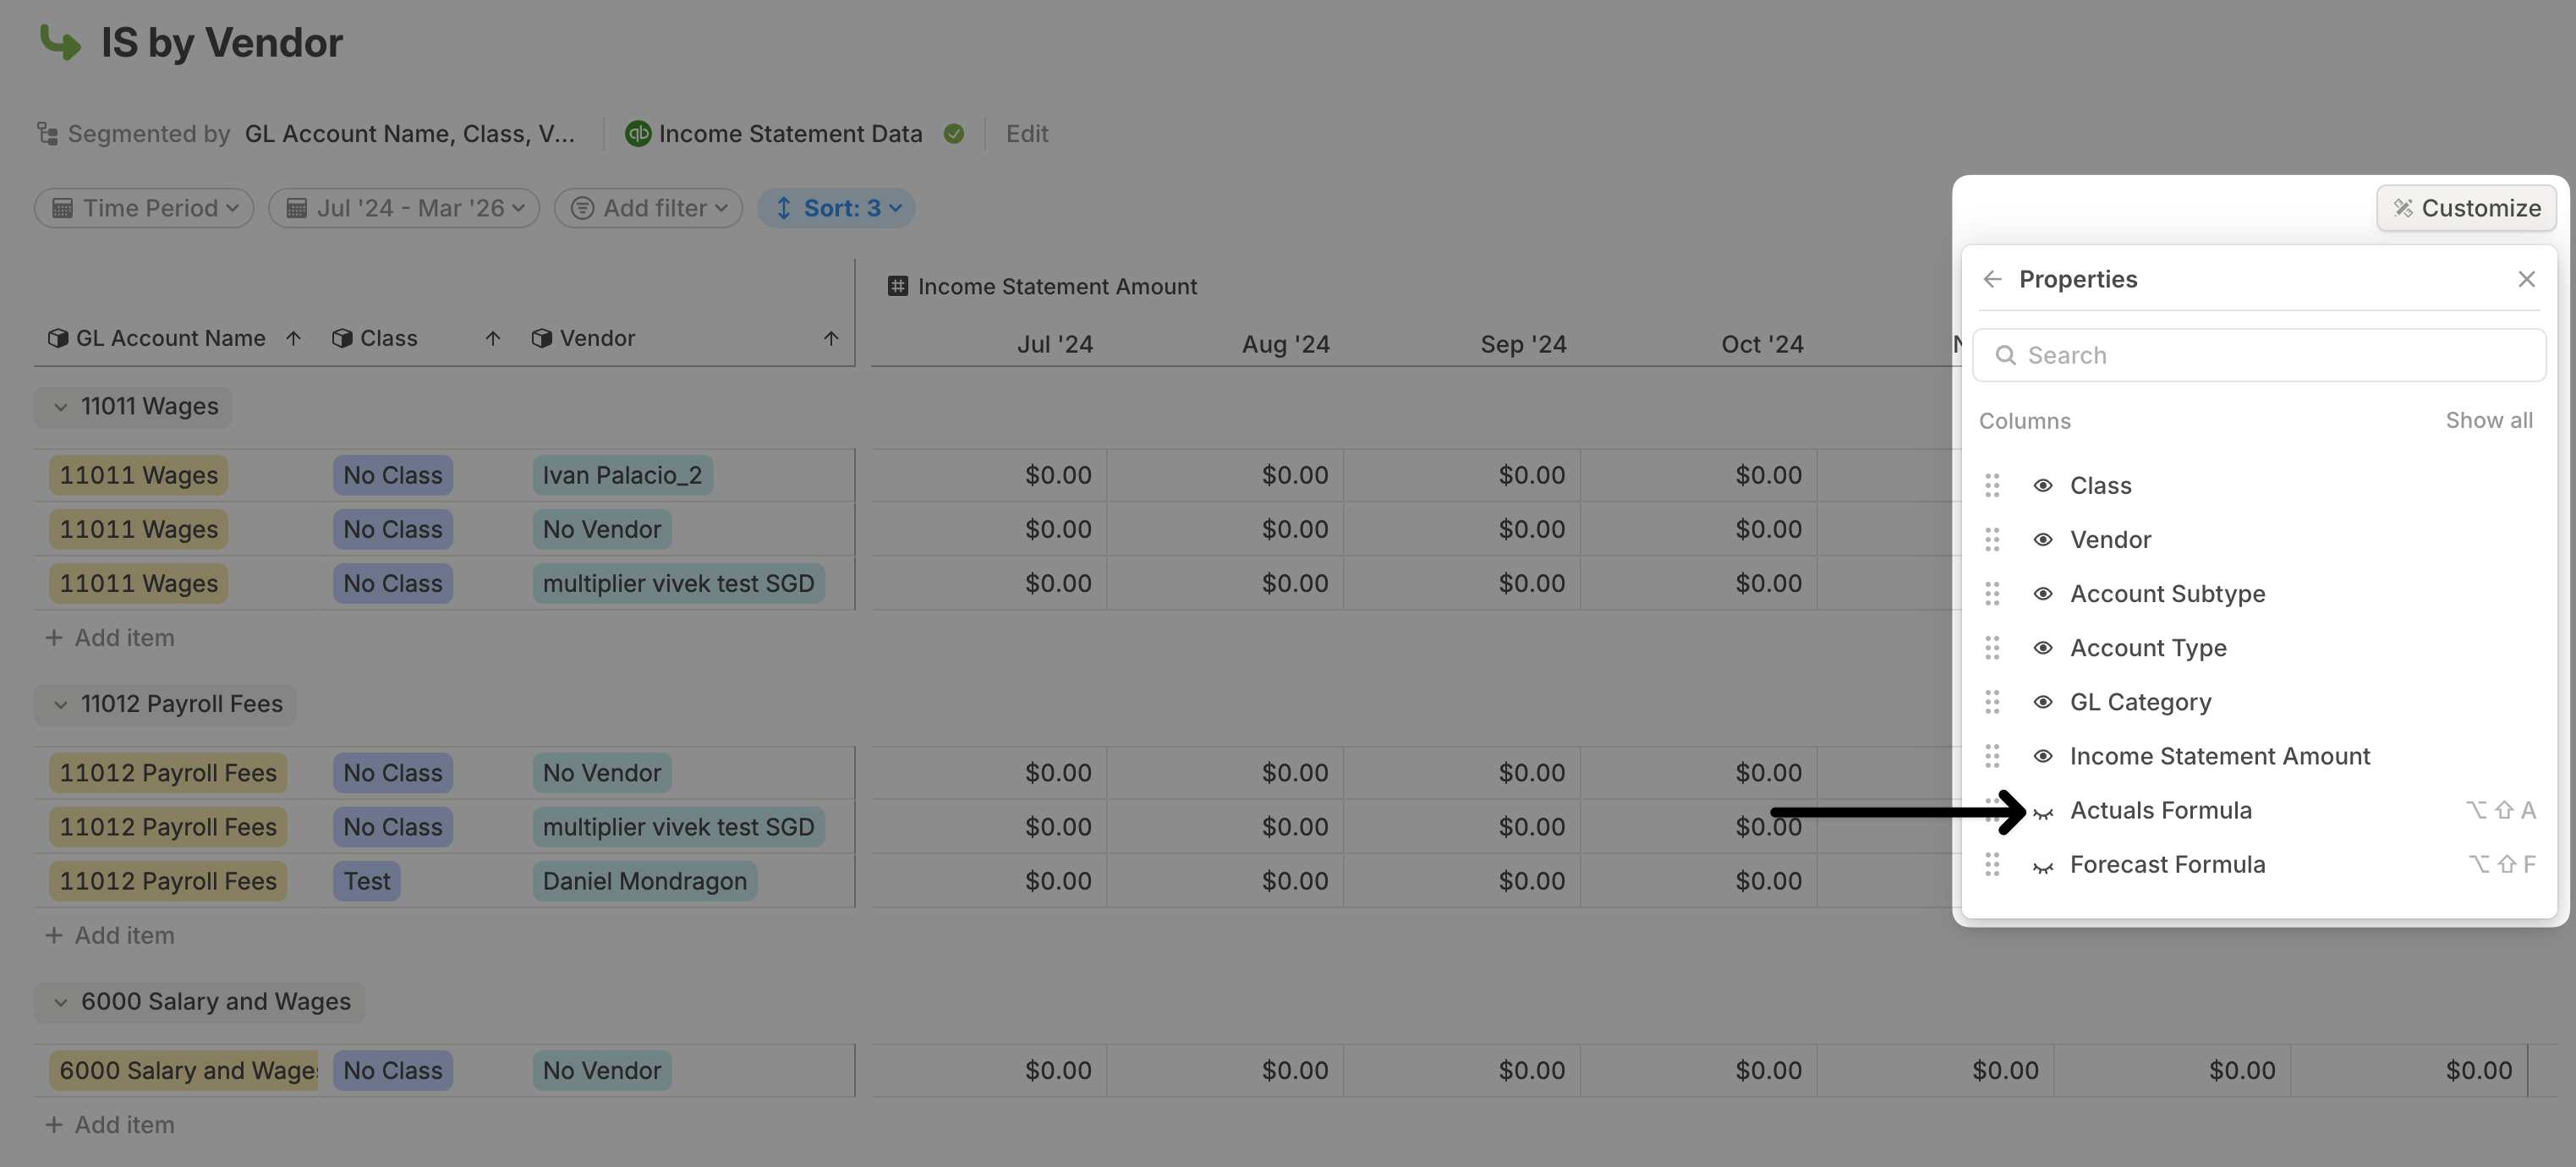
Instead of displaying only one driver column as a time series, you can choose to show all driver columns this way. Click Customize in the top-right corner, select Display as, and then choose Time series.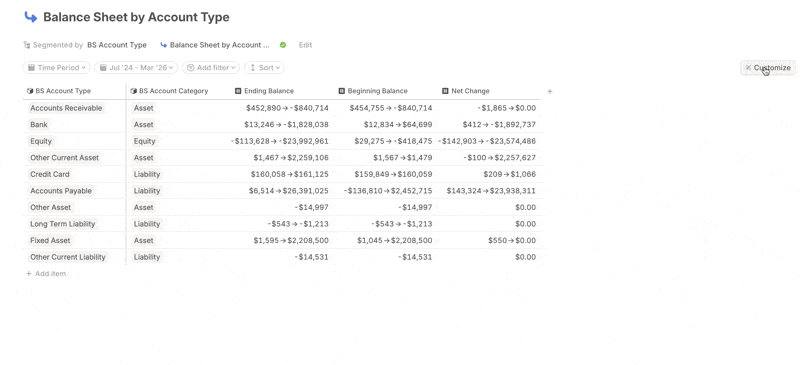
Show & hide columns
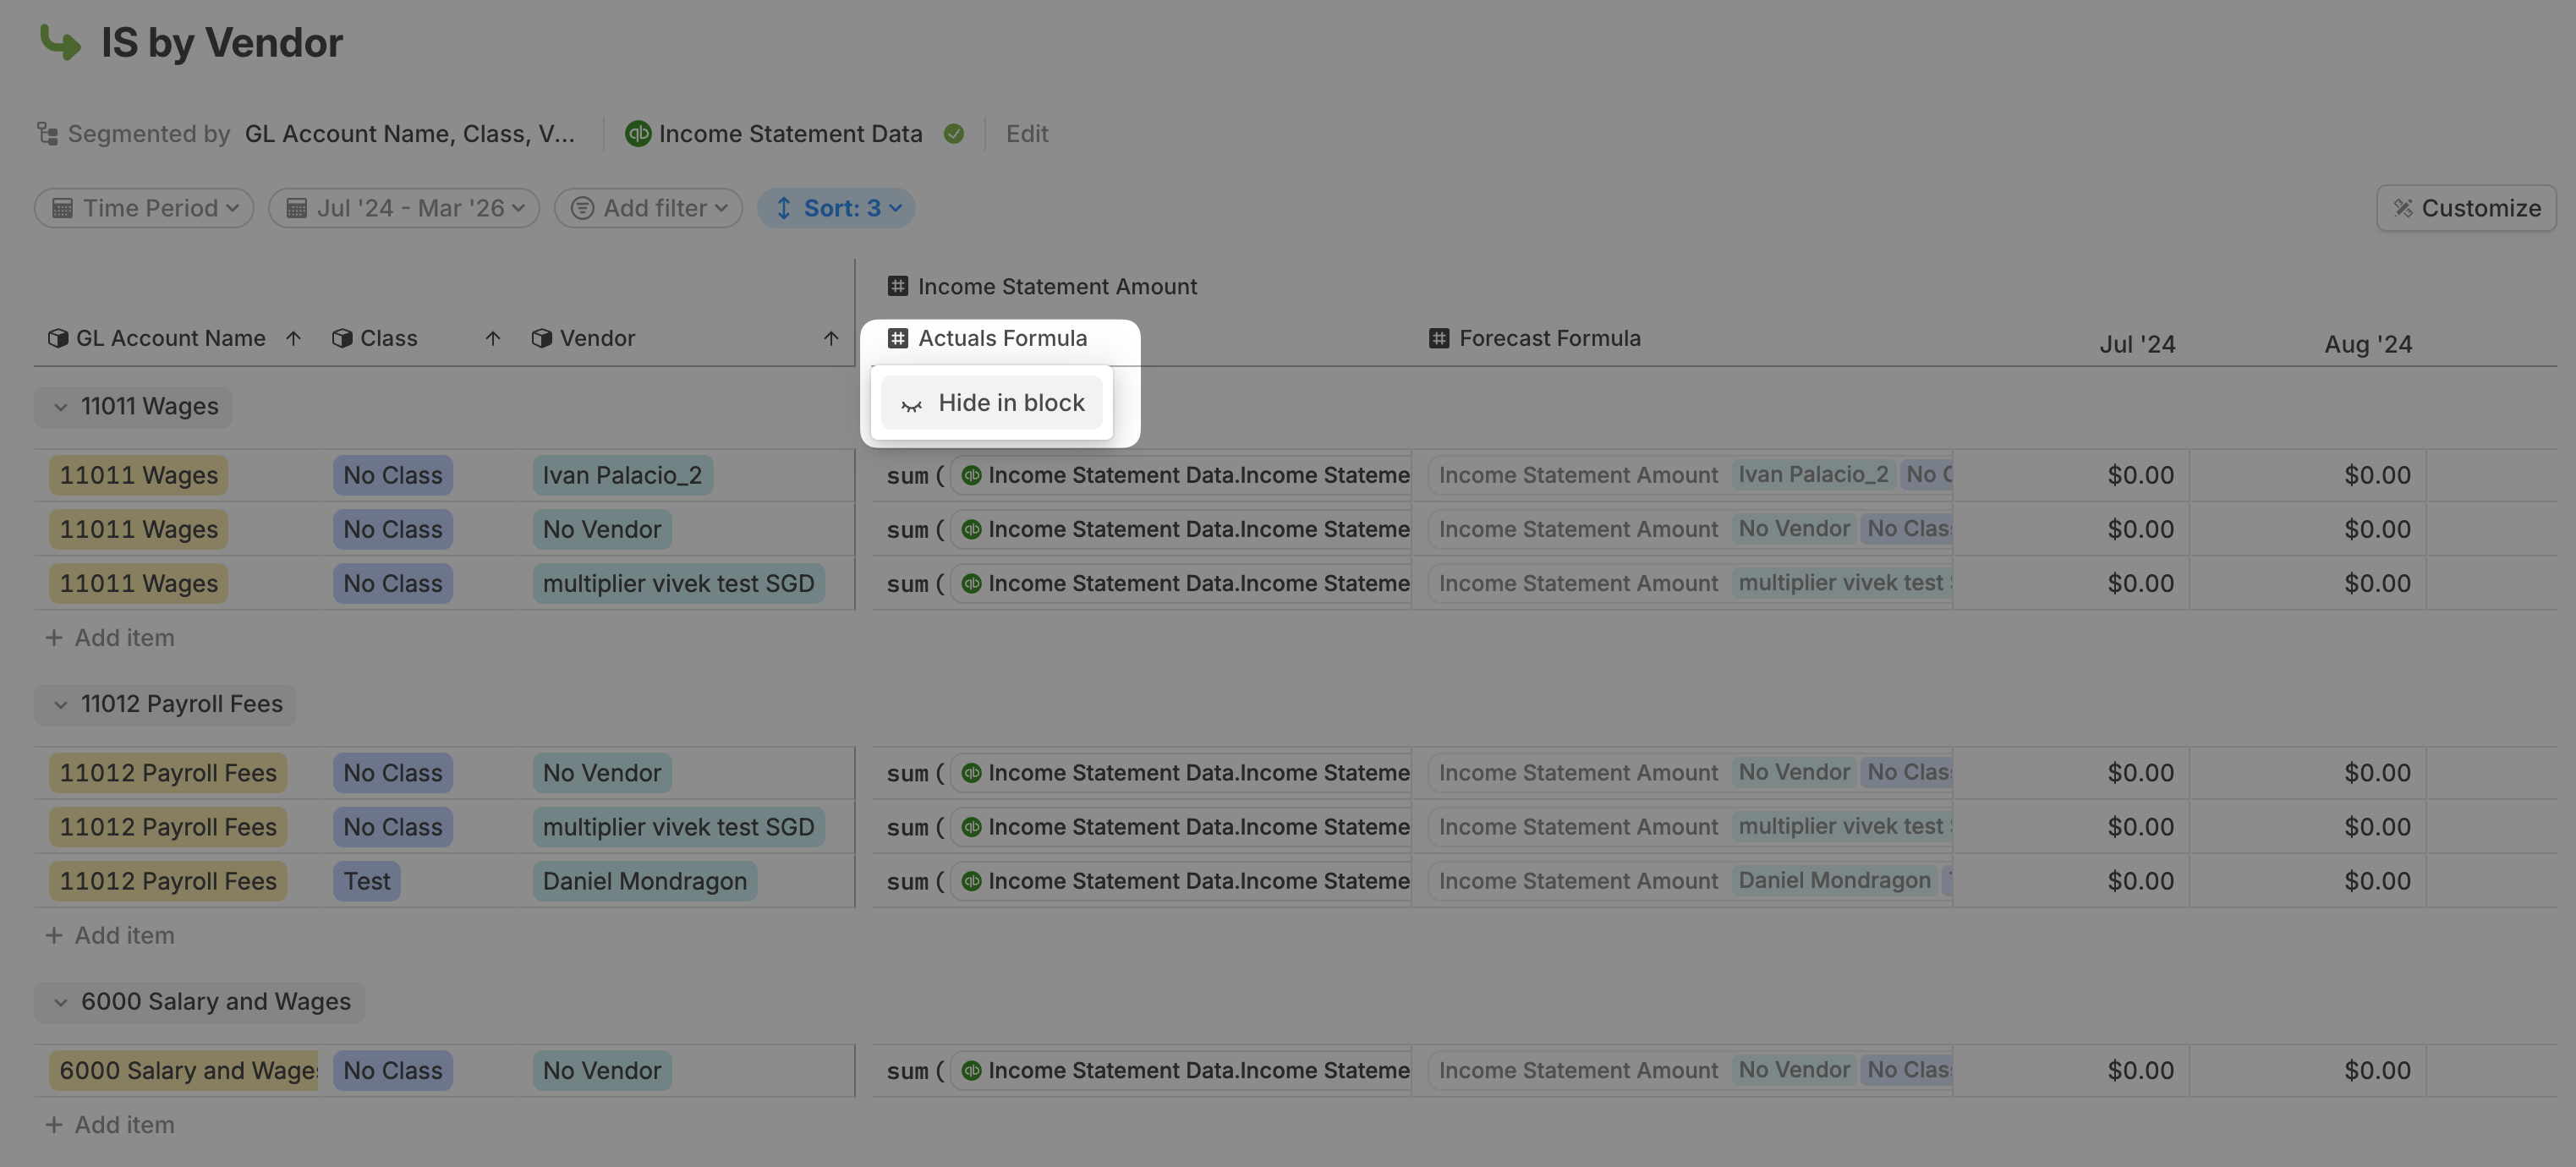
For a more compact view of your data, you can hide columns that are not always relevant and show them only when needed. You can do this by clicking on the column name in the database header and selecting Hide in block.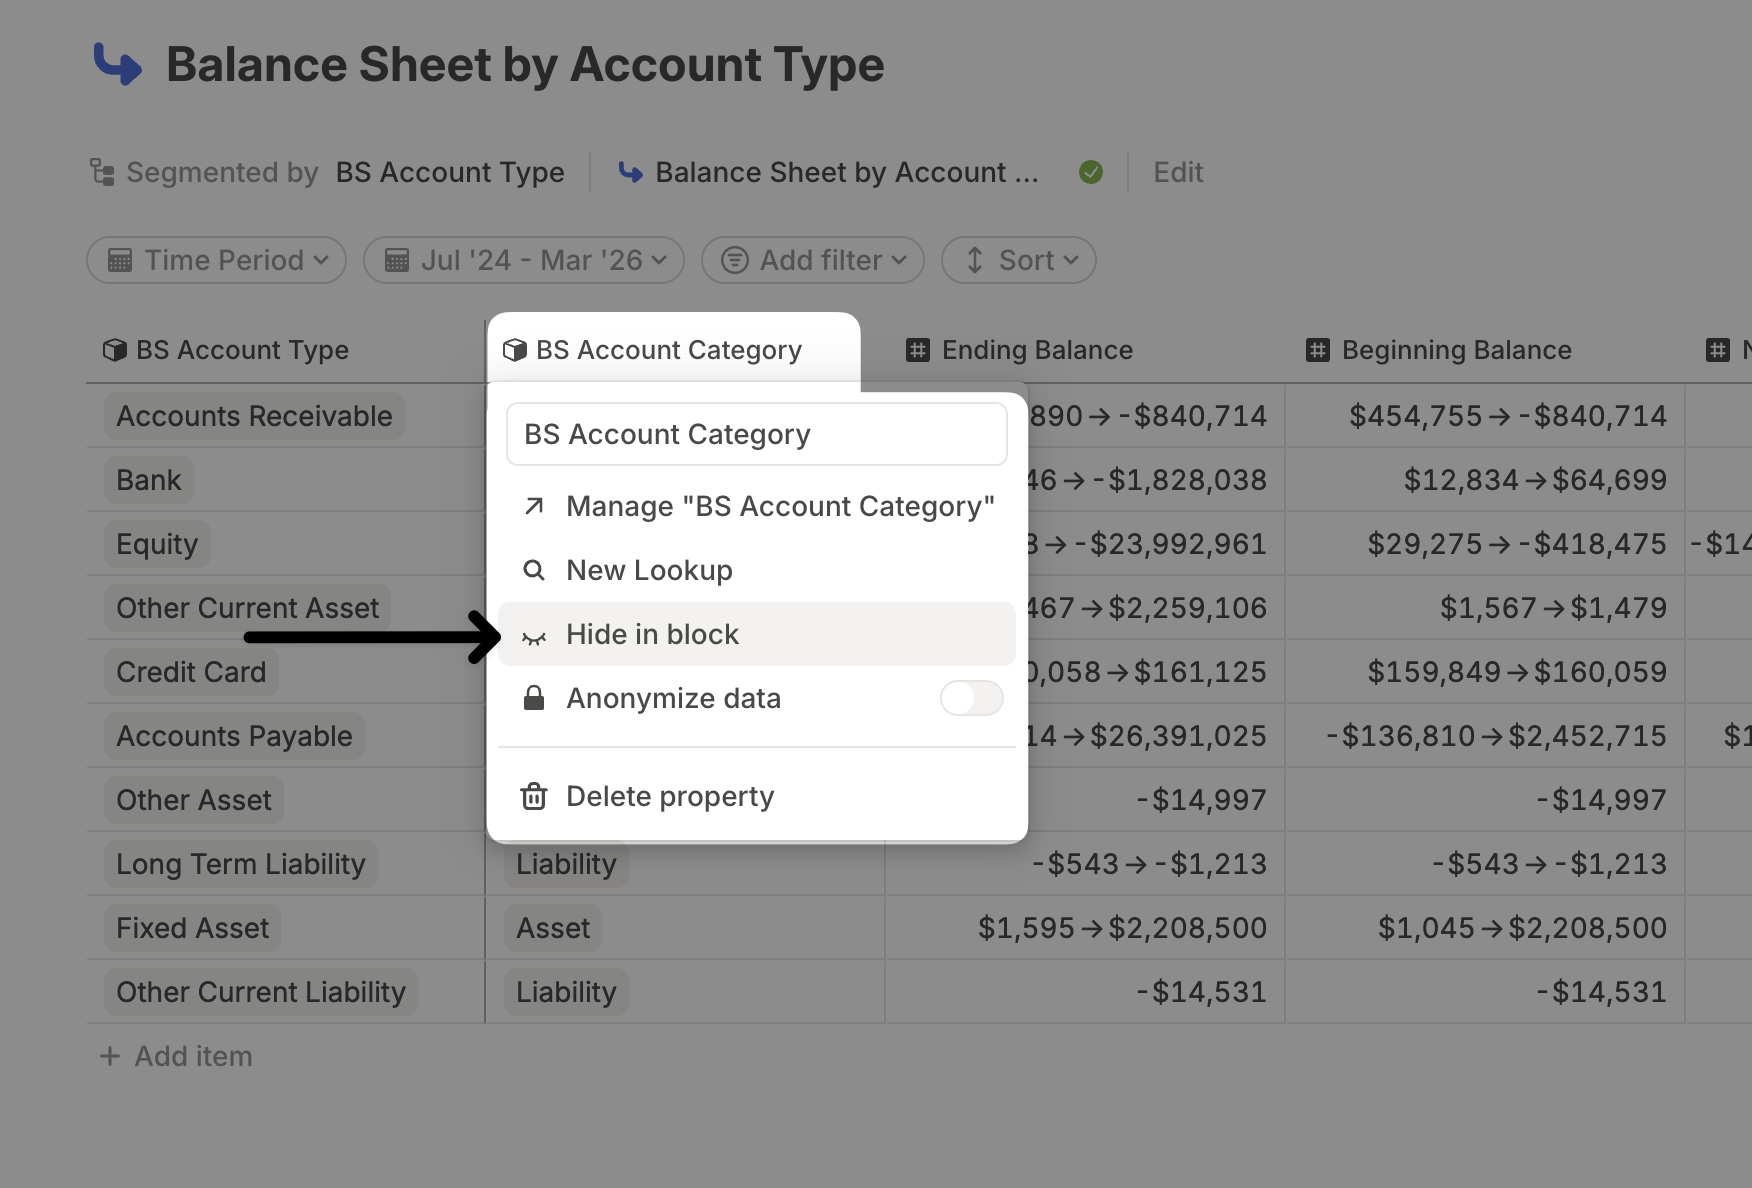
Adding a row
If you need to manually add a row to a database—for example, a new vendor in an Income Statement by Vendor database or a new assumption in an assumptions database—click + Add item. After adding the row, set values for the dimensions used in the Segment by for this database.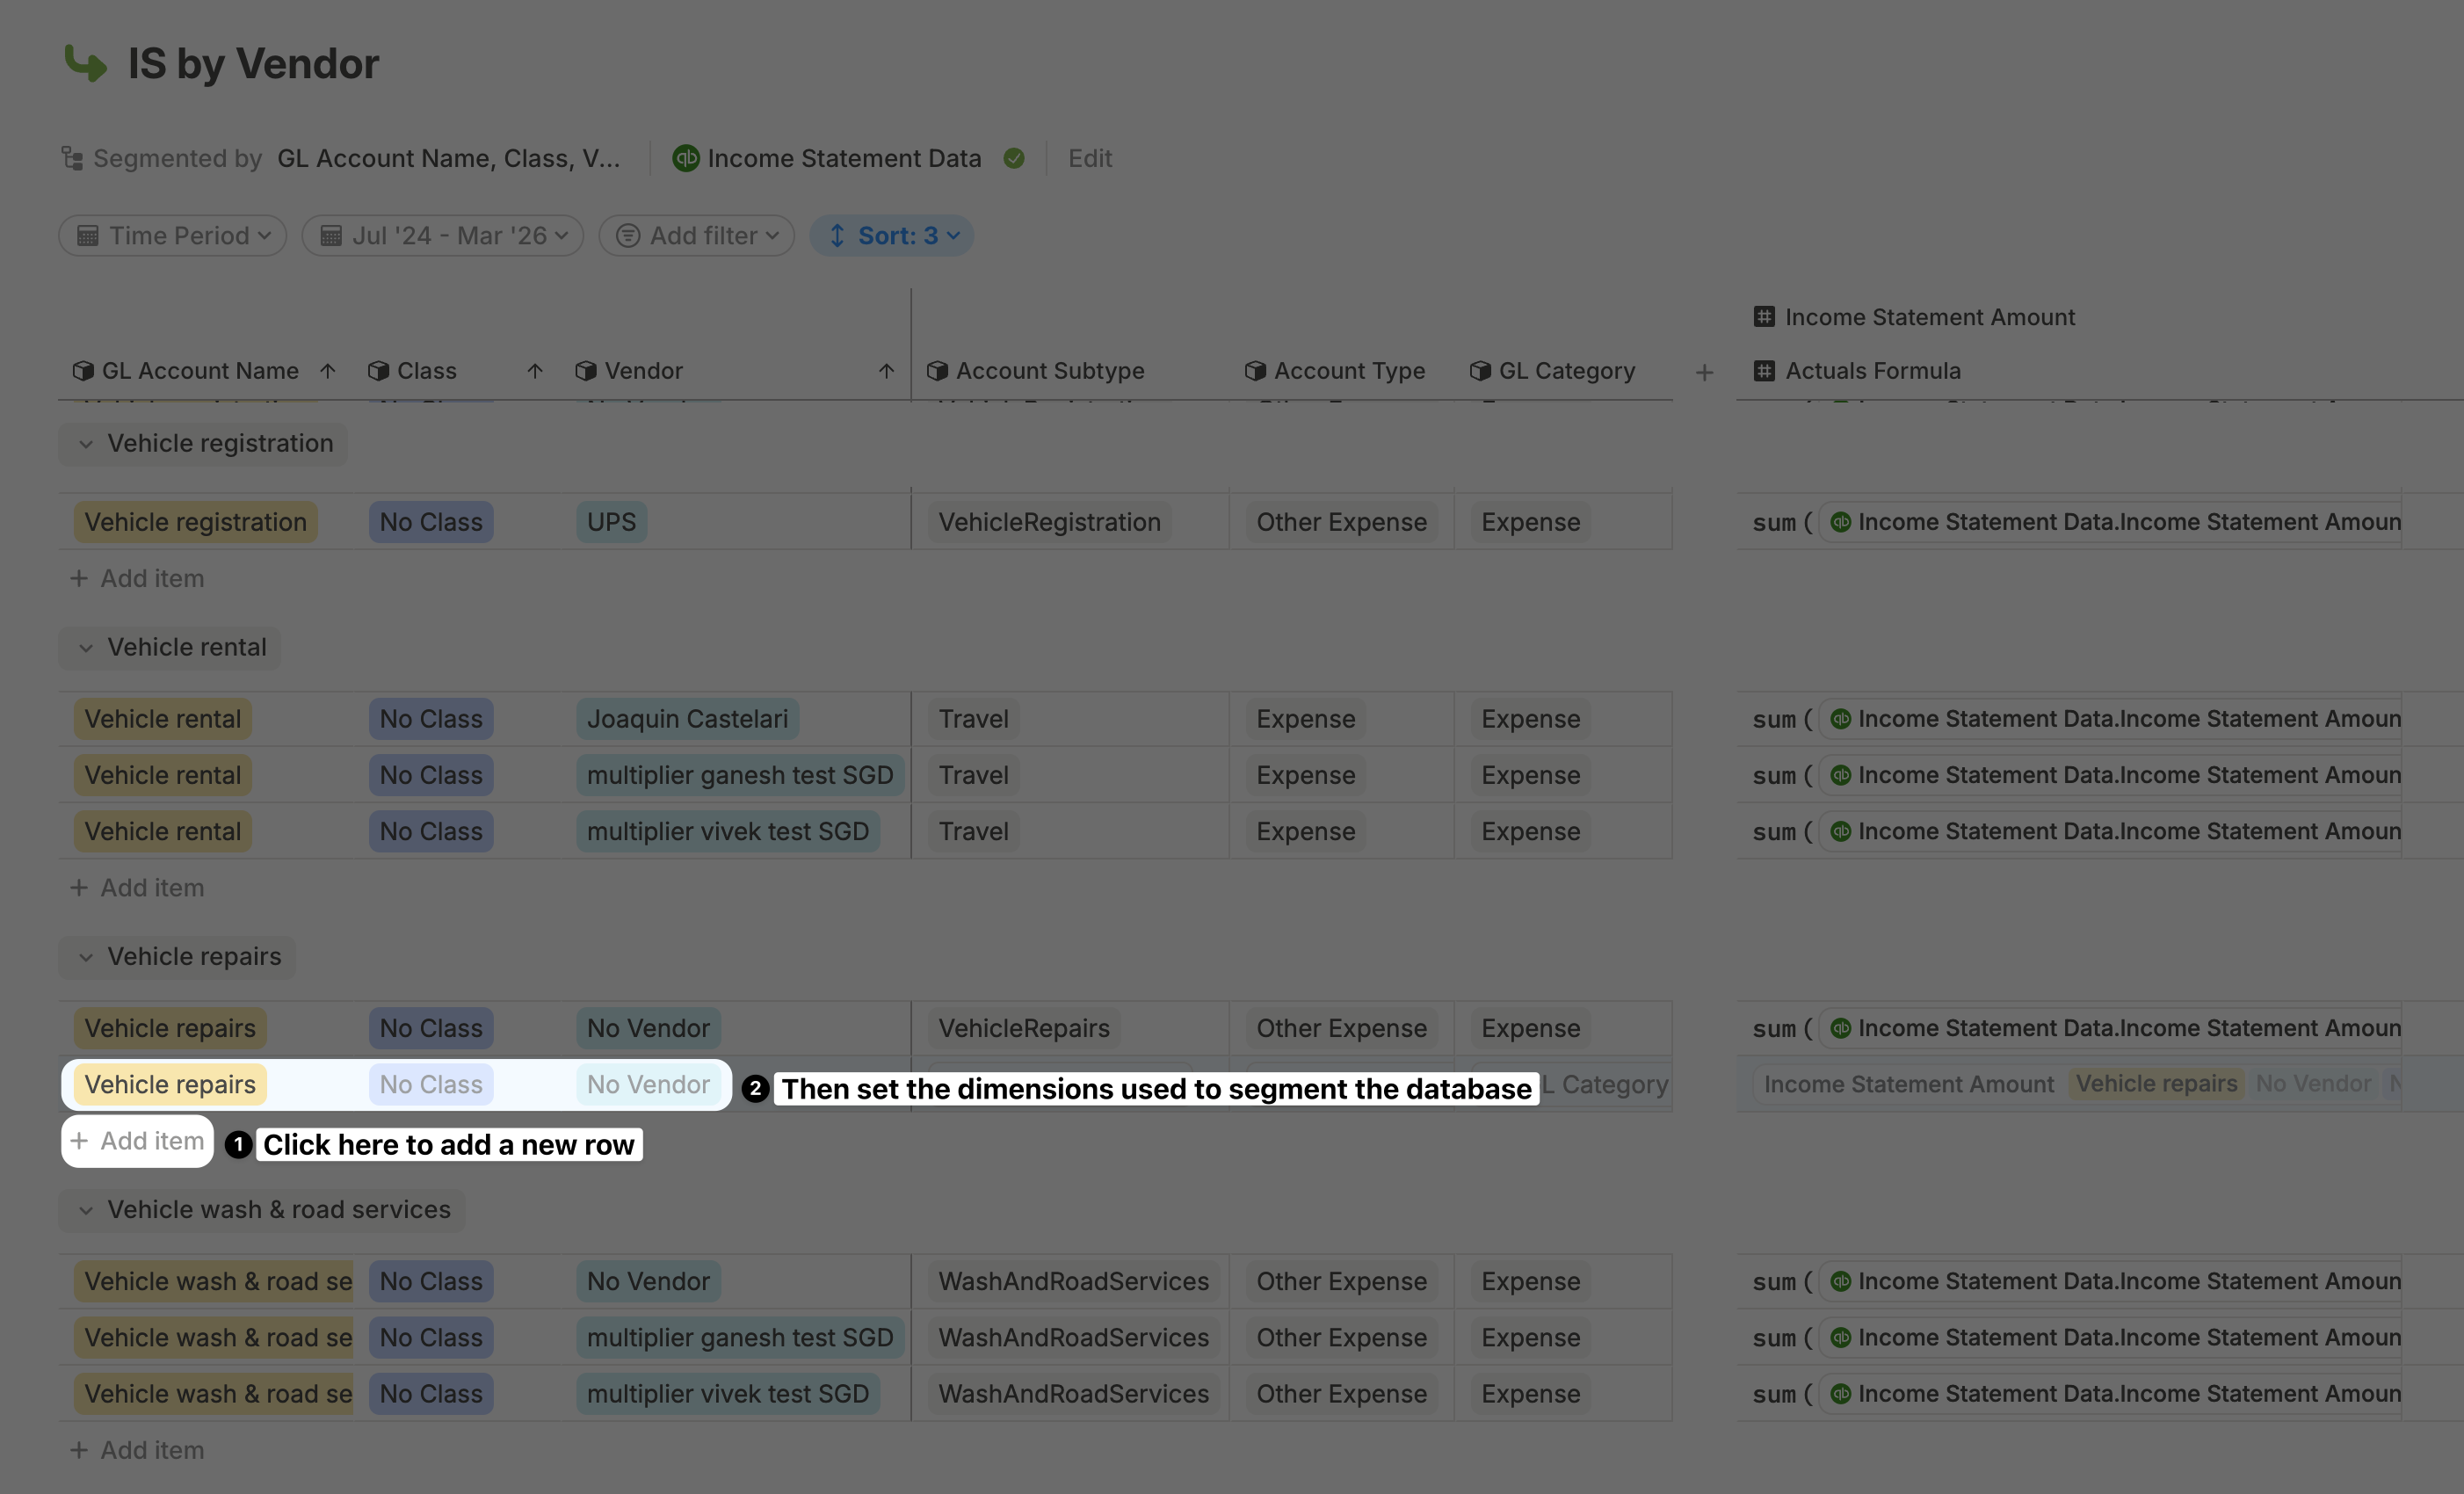
- If a row does not have a unique combination, you’ll see a warning next to it.
- This means the row is linked to other rows sharing the same segmentation. Any changes made to one of these rows will automatically update the others.
For HRIS databases, the process of adding a row is different. Please follow the steps here.
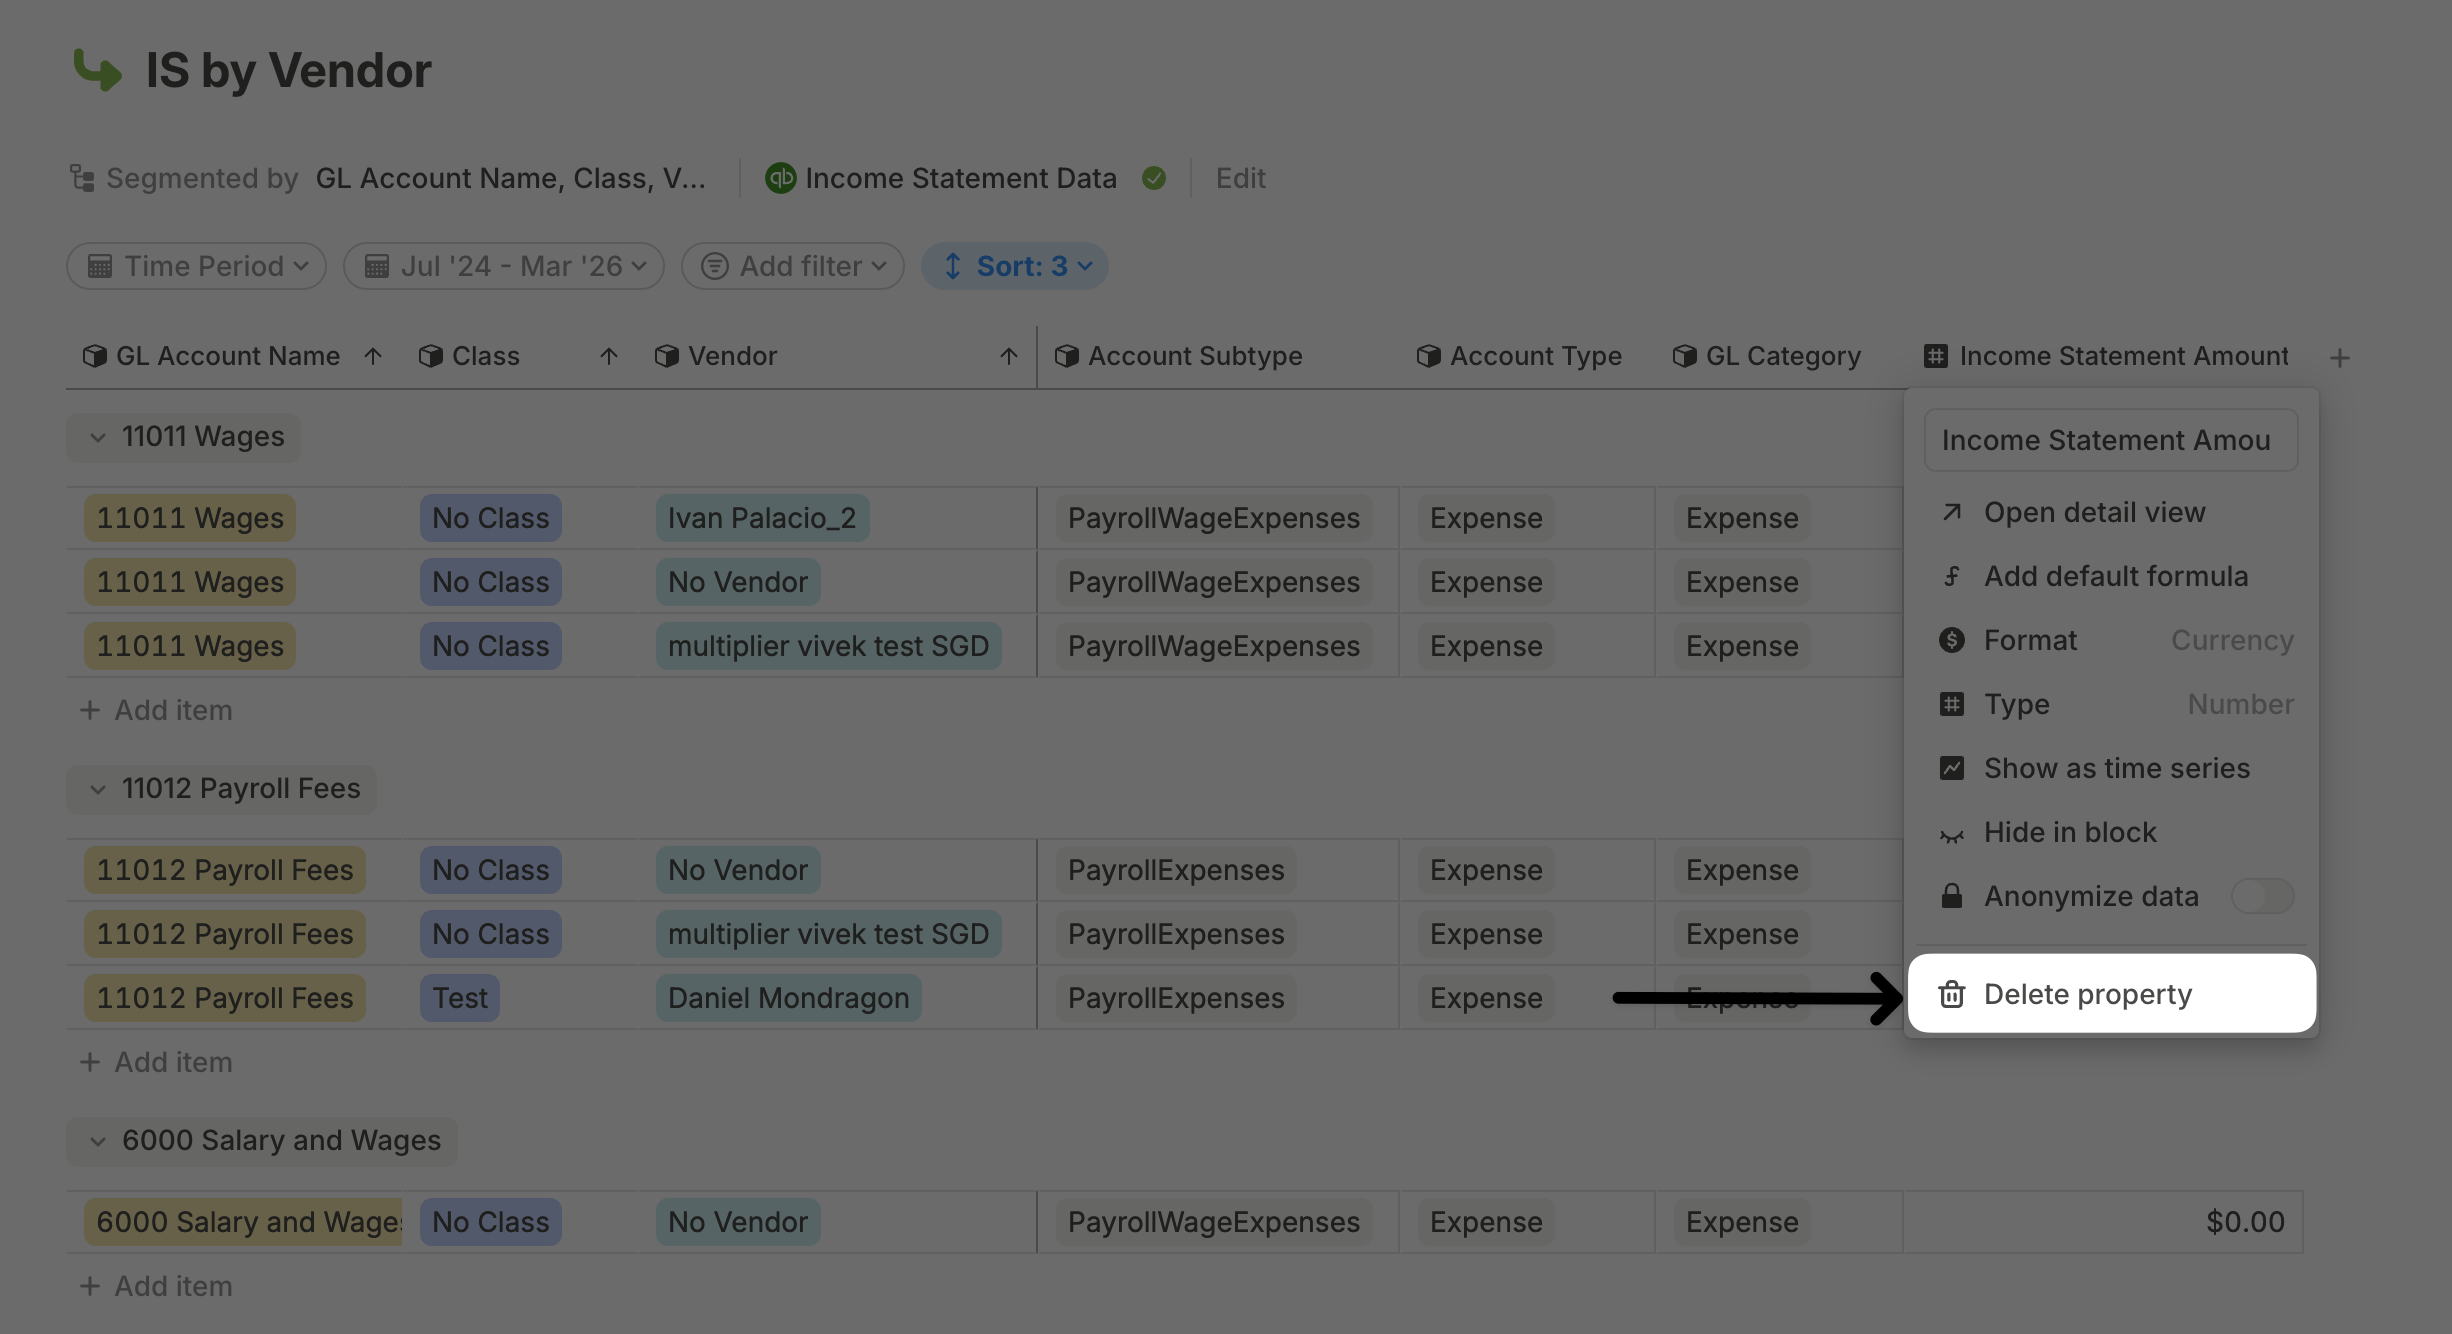
Deleting a column
To delete a column from a database, the process depends on how the column was added. For columns coming from the database configuration – Remove the column from the relevant section in the configuration (Driver, Segment by, or Other Columns). This ensures the column does not reappear after the next integration sync or configuration refresh.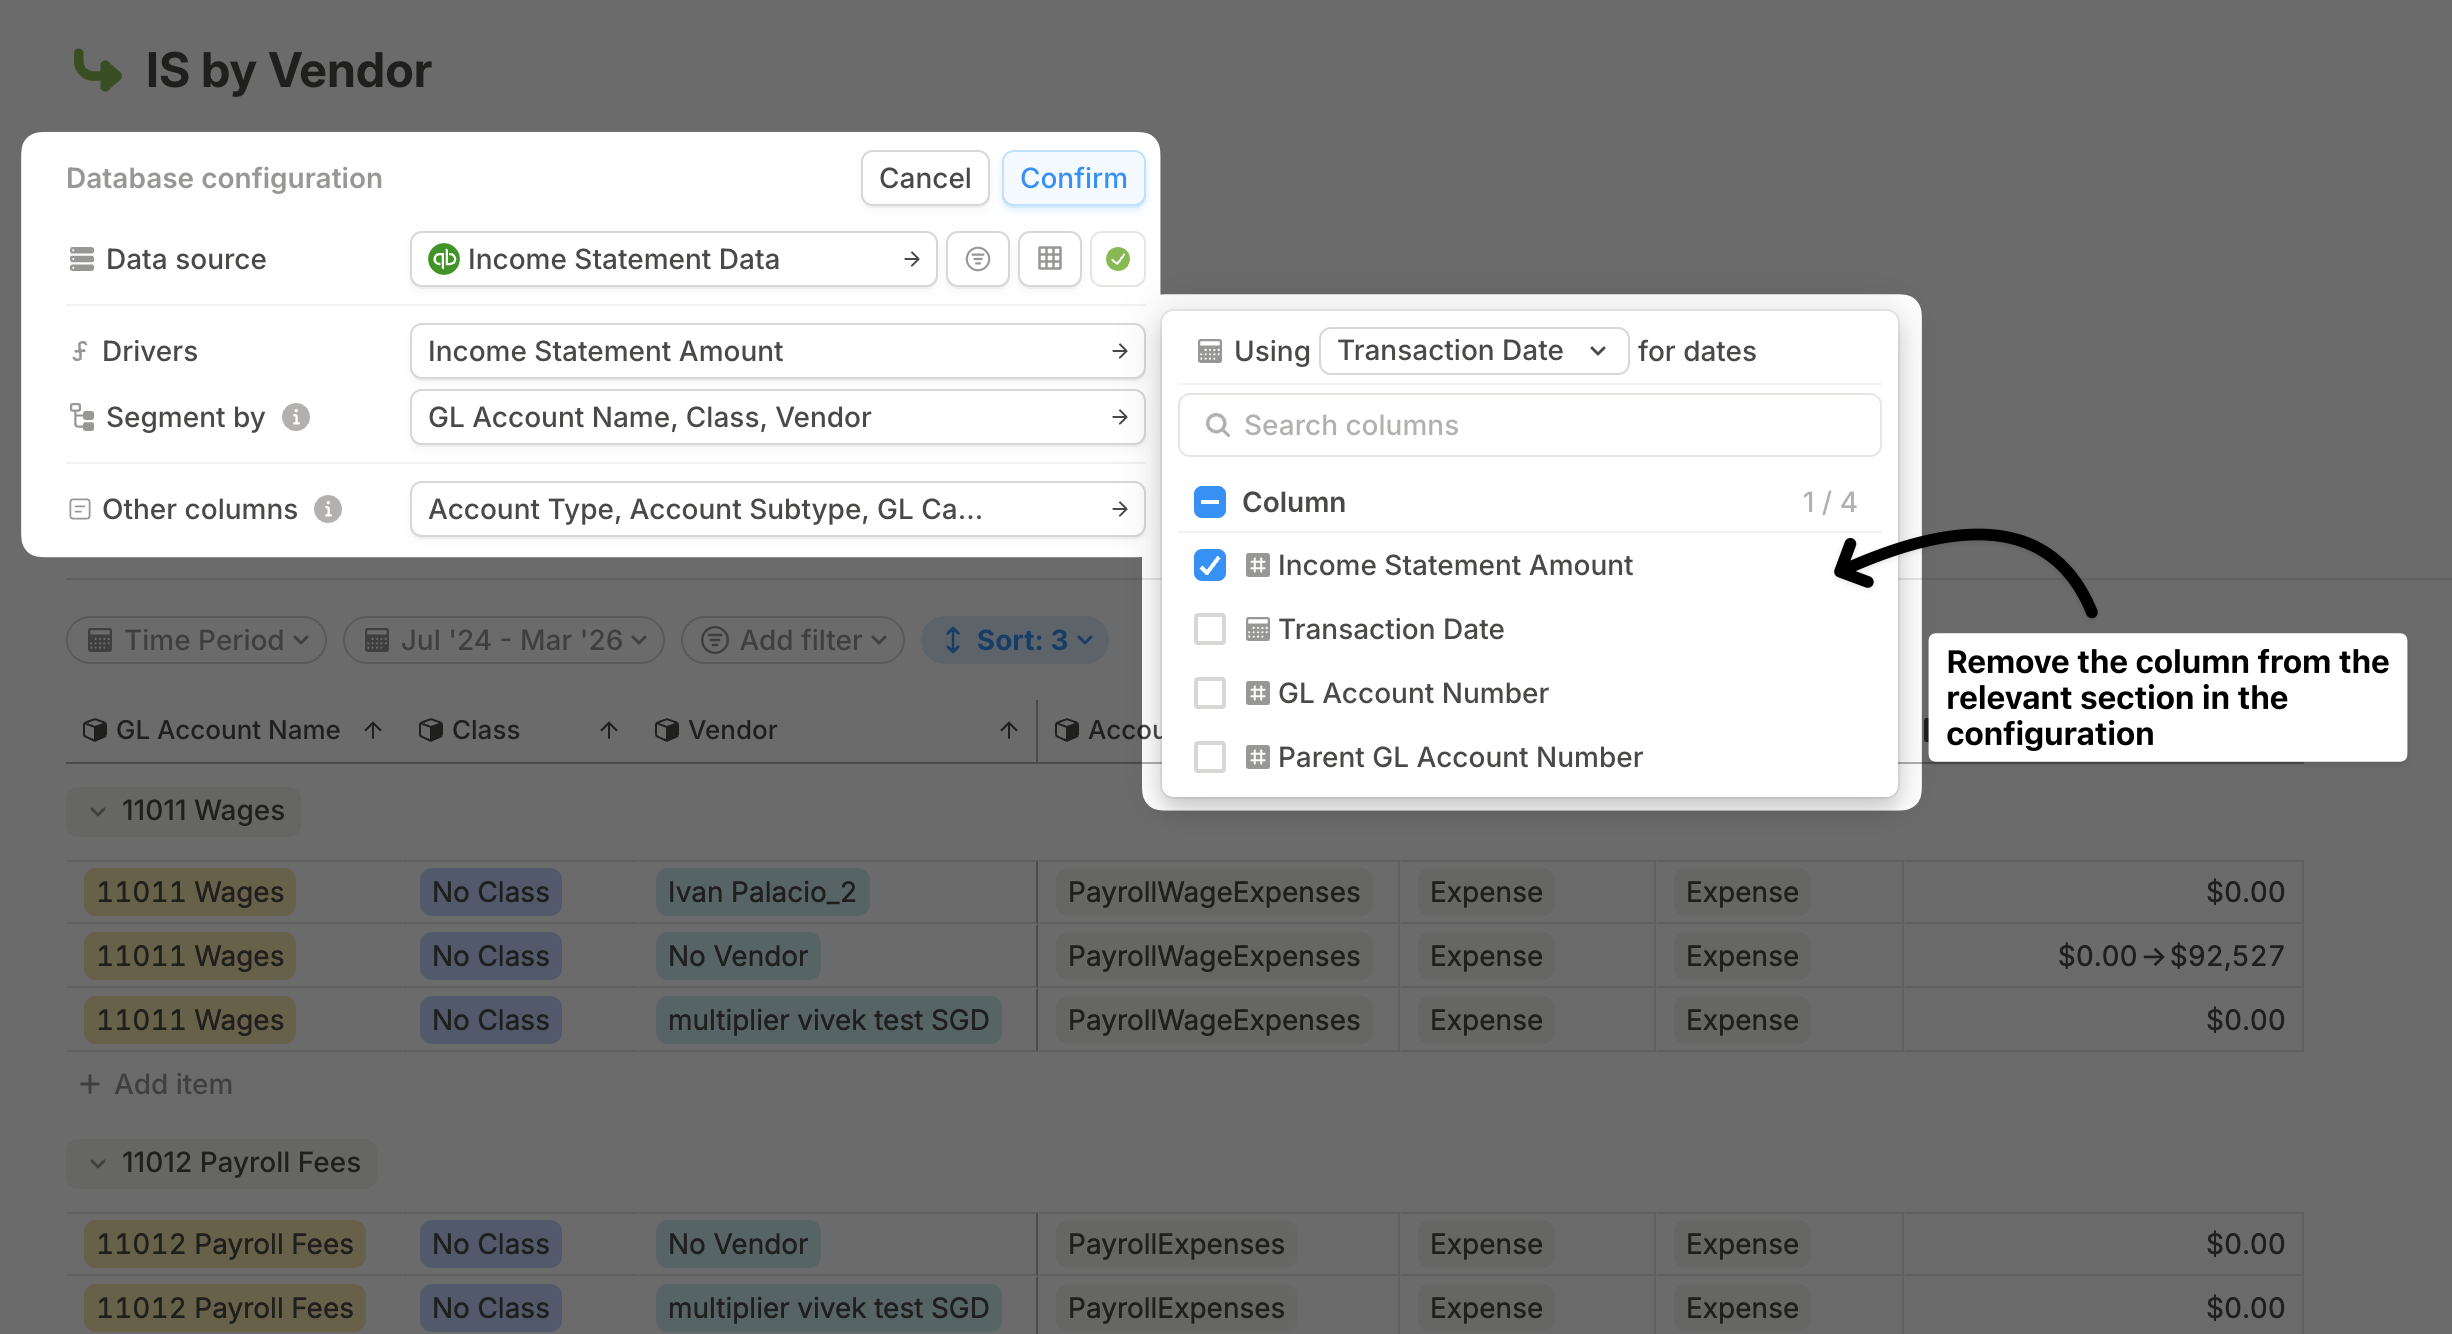
Deleting a row
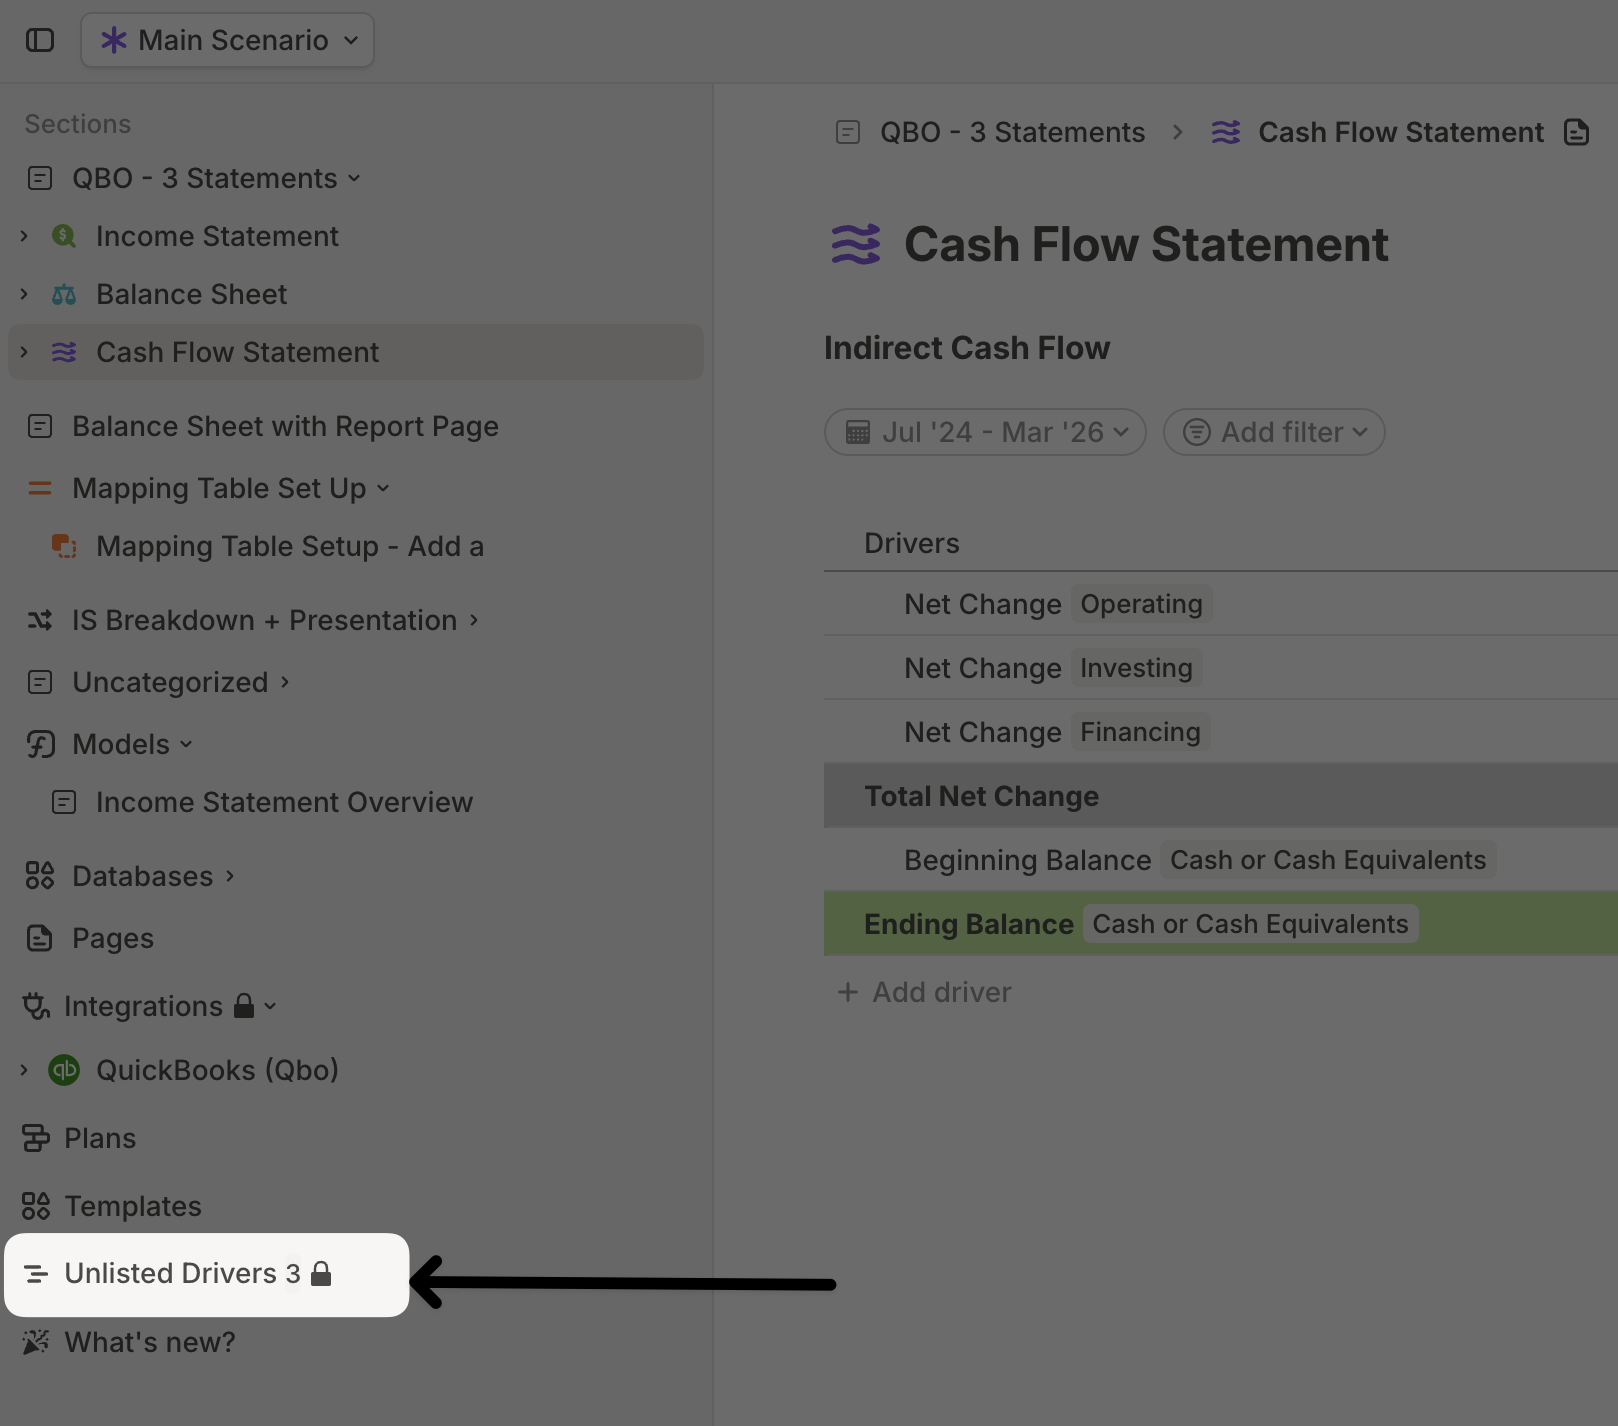
To delete a row from a database, right-click on the row and select Delete row. To fully delete a driver and eliminate its impact on formulas, you need to delete it from the Unlisted drivers page.