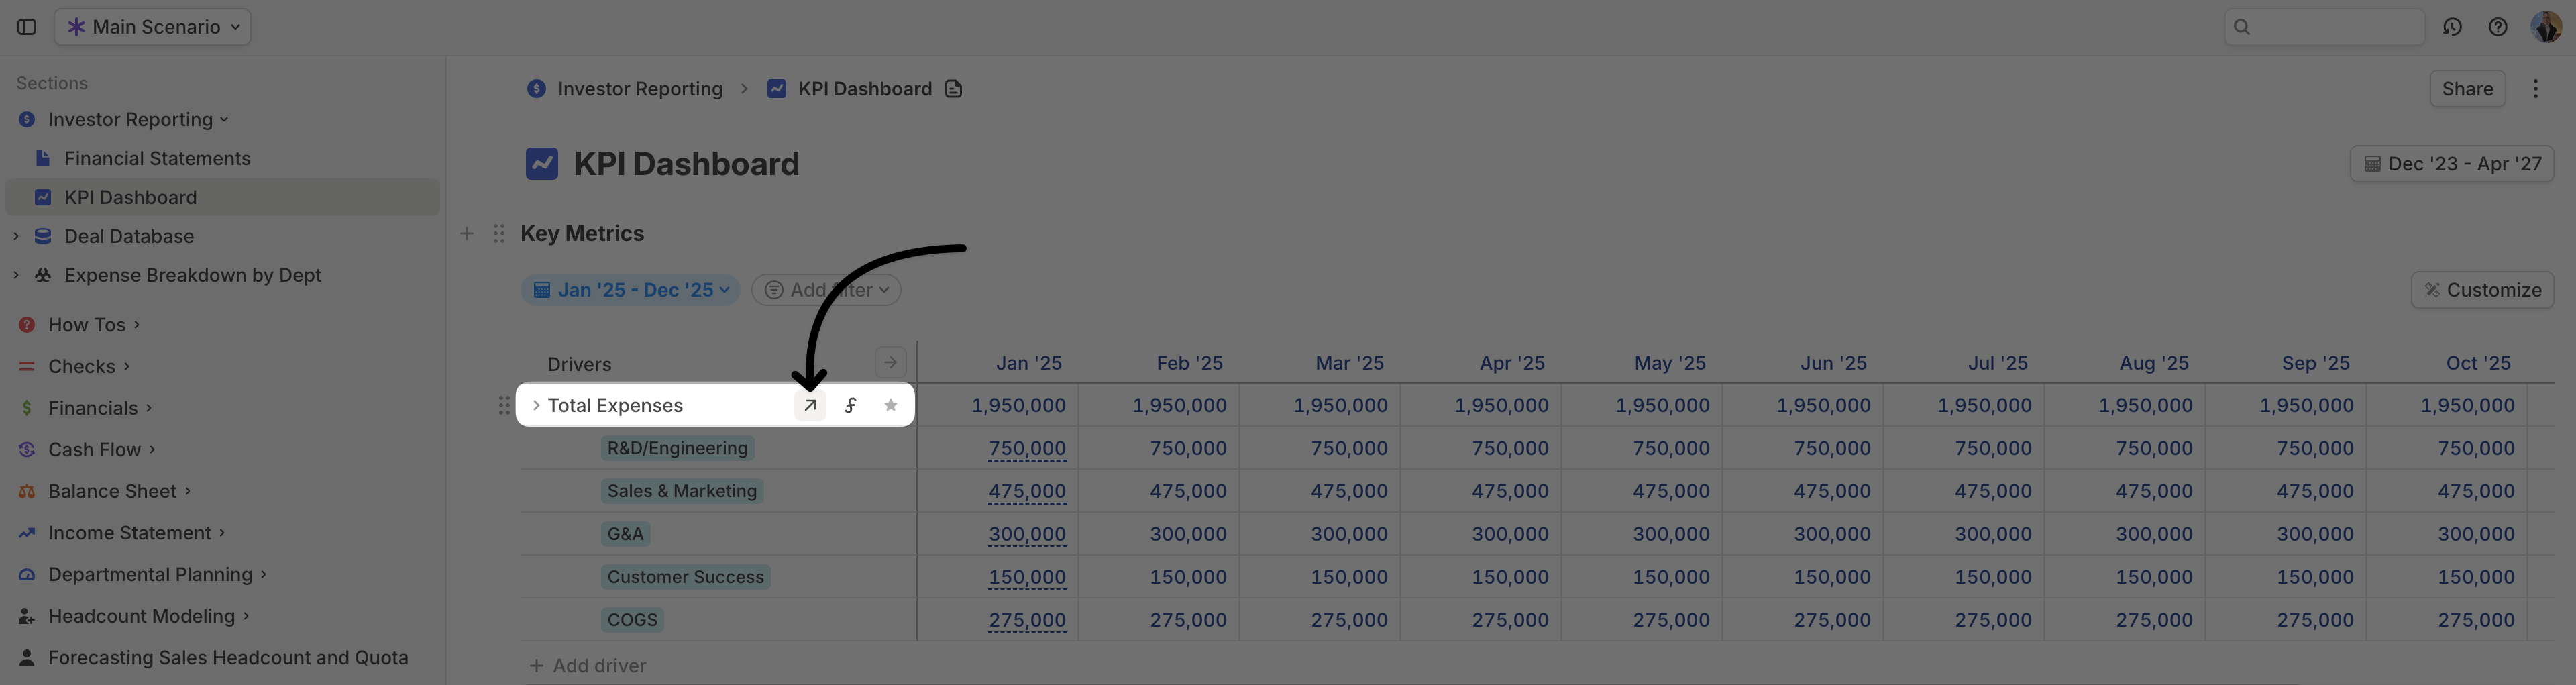
How to access the details pane
- Click the ↗️ arrow on any driver row.
- Use the shortcut
Cmd (Ctrl)+Shift+Enterwhile a driver is selected.
- Viewing and editing all driver settings in one place.
- Exploring the inputs that contribute to a driver’s values to troubleshoot discrepancies or errors.
What’s inside the driver details pane?
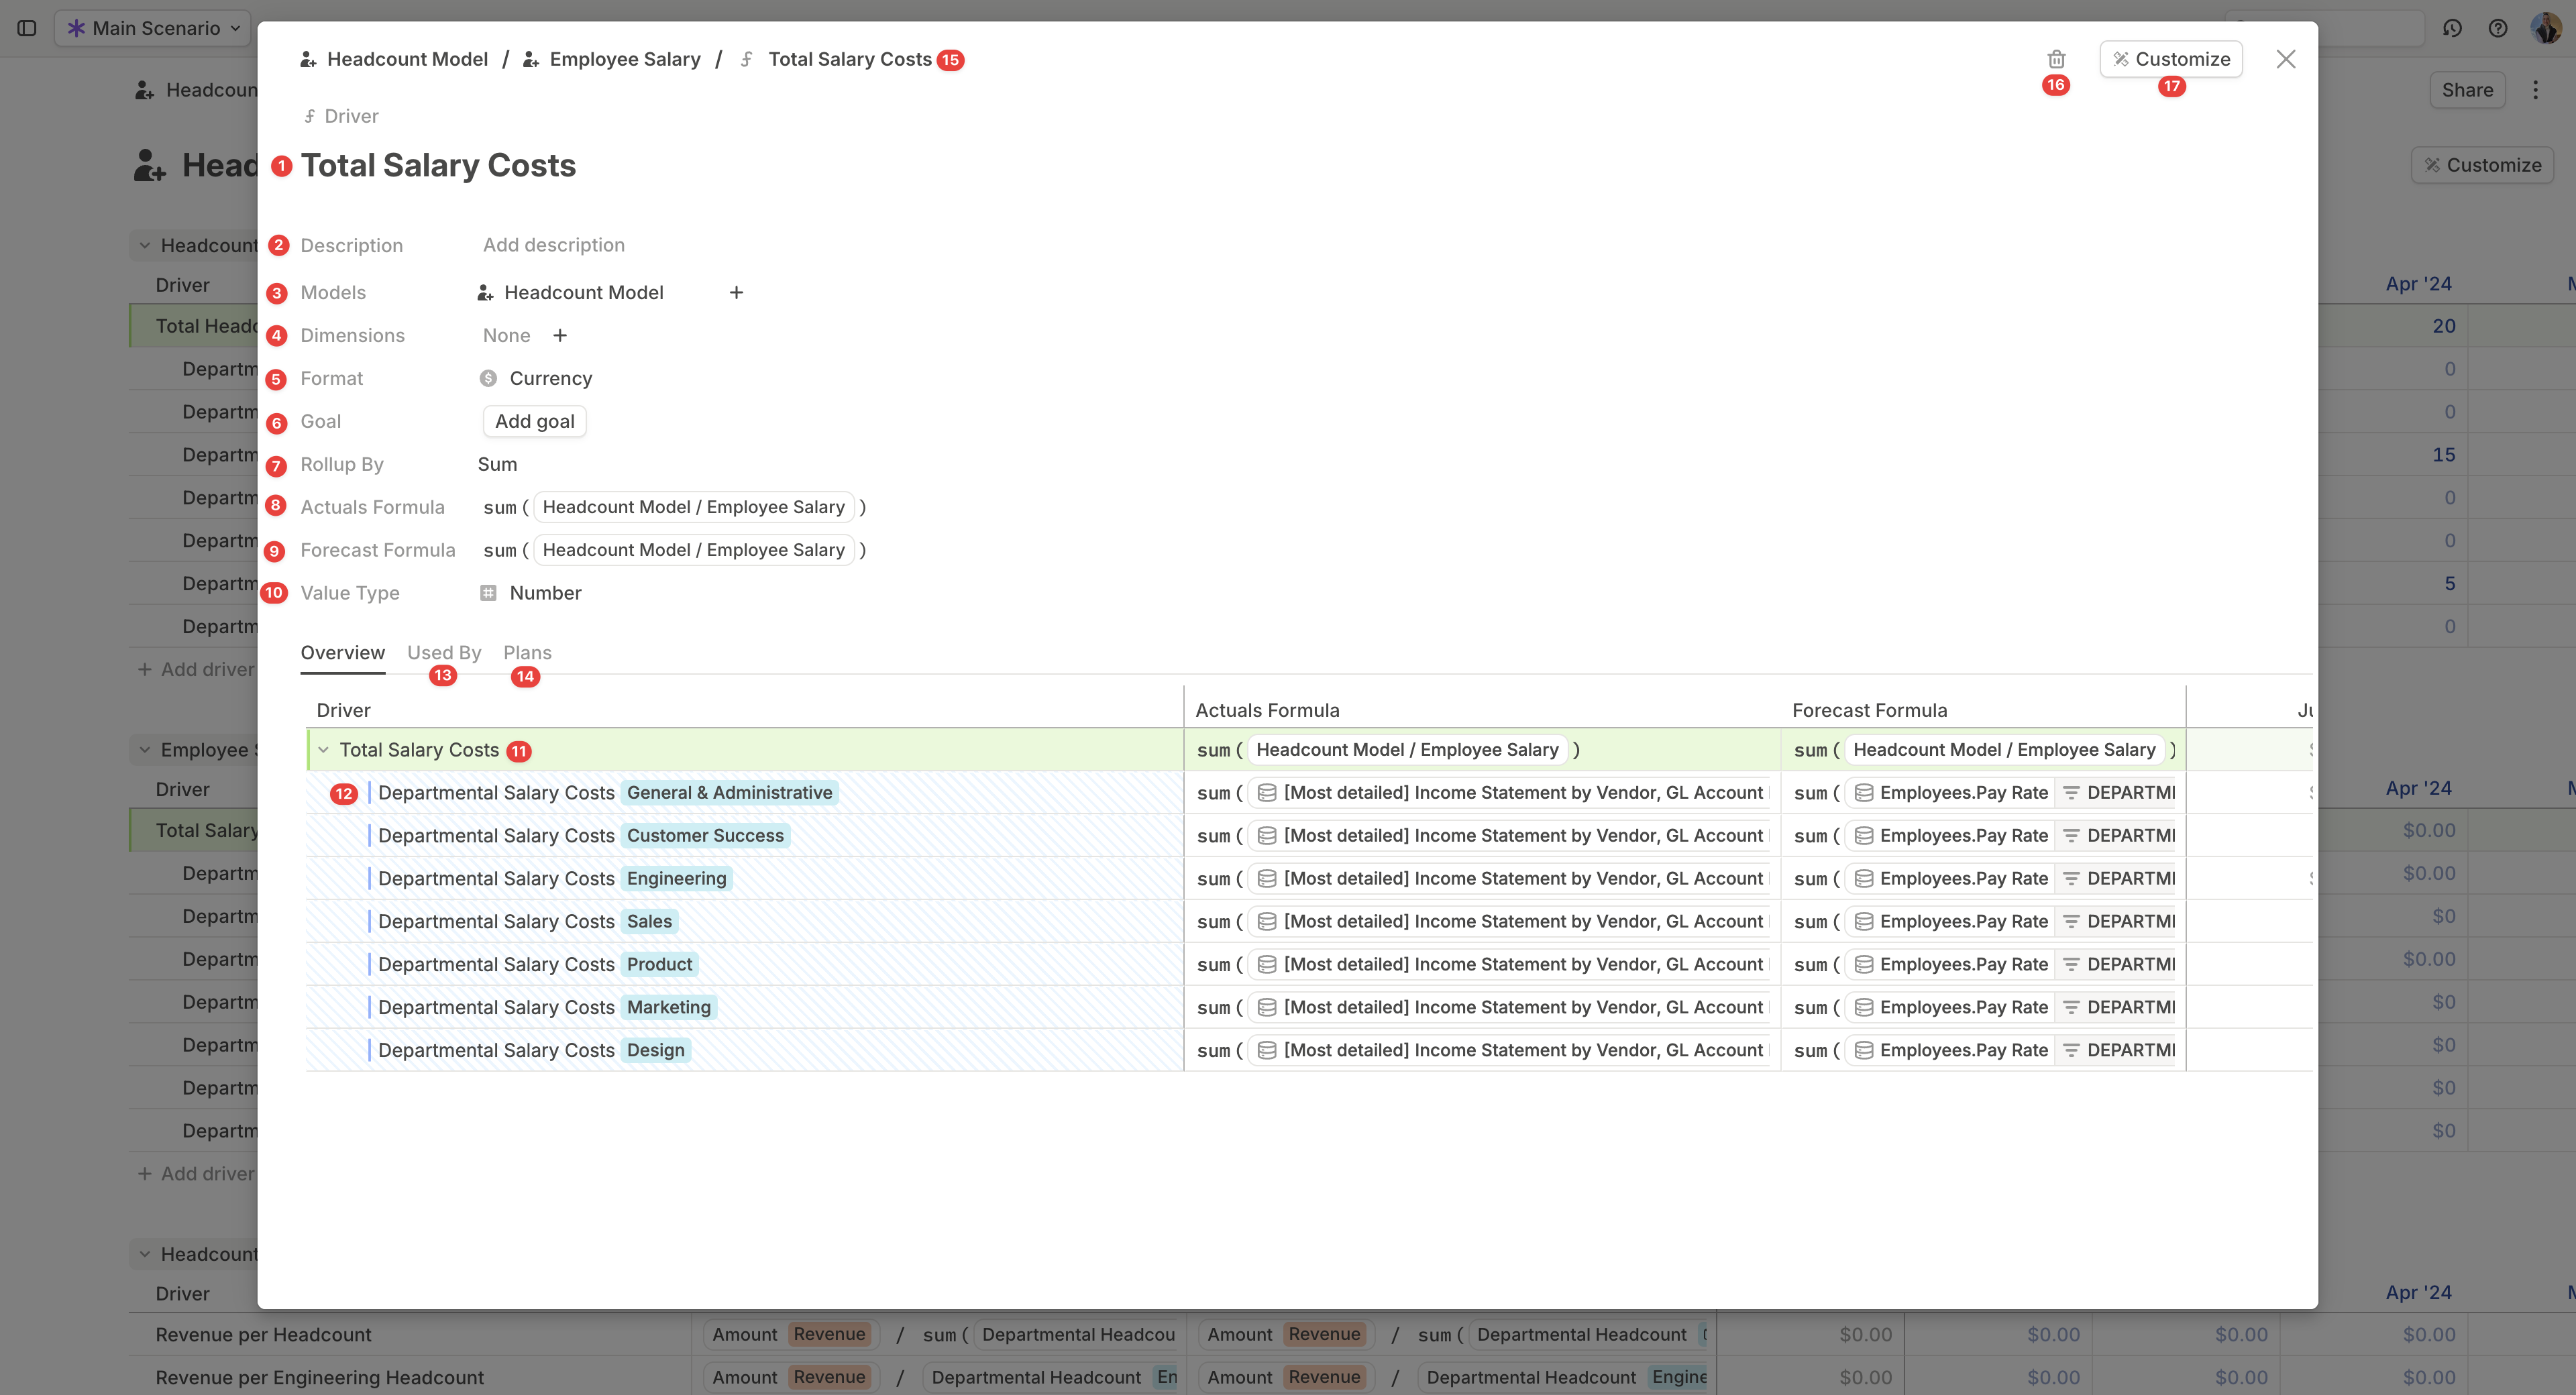
- Name – The driver’s name.
- Description – Context or notes about the driver.
- Models – Lists all pages where the driver is used.
- Dimensions – Explains how the driver is segmented. Learn more about dimensions.
- Format – Adjusts display settings for numeric drivers.
- Goal – Assign a target value to the driver.
- The target appears as a goal line when plotted on a chart.
- Used in scenario comparisons or BvA (Budget vs. Actuals) to determine whether values are displayed as red or green.
- By default, higher values are considered better.
- Rollup by – Specifies how the driver’s values aggregate when viewing time periods longer than one month, such as quarterly, year-to-date, or annual (e.g. sum, first, last).
- Actuals formula – Expanded space for editing the driver’s actuals formula.
- Forecast formula – Expanded space for editing the driver’s forecast formula.
- Driver type – Clearly indicates whether the driver stores Numbers, Dates, or Attributes.
- Driver timeseries – A dedicated table displaying the driver’s values over time. The columns are controlled by settings under Customize.
- Drill-in – Click the caret to show all inputs contributing to this driver (i.e., referenced in its formula).
- Used by – Lists all other drivers that reference this driver in their formulas.
- Plans – Displays any Plans applied to this driver.
- Breadcrumbs – Shows where the driver is located in your model.
- Delete – Click the trash can icon to delete the driver.
- Customize menu – Adjusts which columns and time ranges are displayed in the driver timeseries table.