Overview
This workflow involves adding dynamic ranking calculations to your existing databases, then using filters to display only your top performers. Rankings update automatically as your underlying data changes, ensuring you’re always seeing current top performers.Step 1: Prepare your database
You’ll need an existing database with the metric you want to rank by. Common examples include:- Customer database with ARR or revenue metrics
- Vendor database with annual spending amounts
- Contract database with contract values
- Employee database with salary or quota metrics
Step 2: Add a rank calculation column
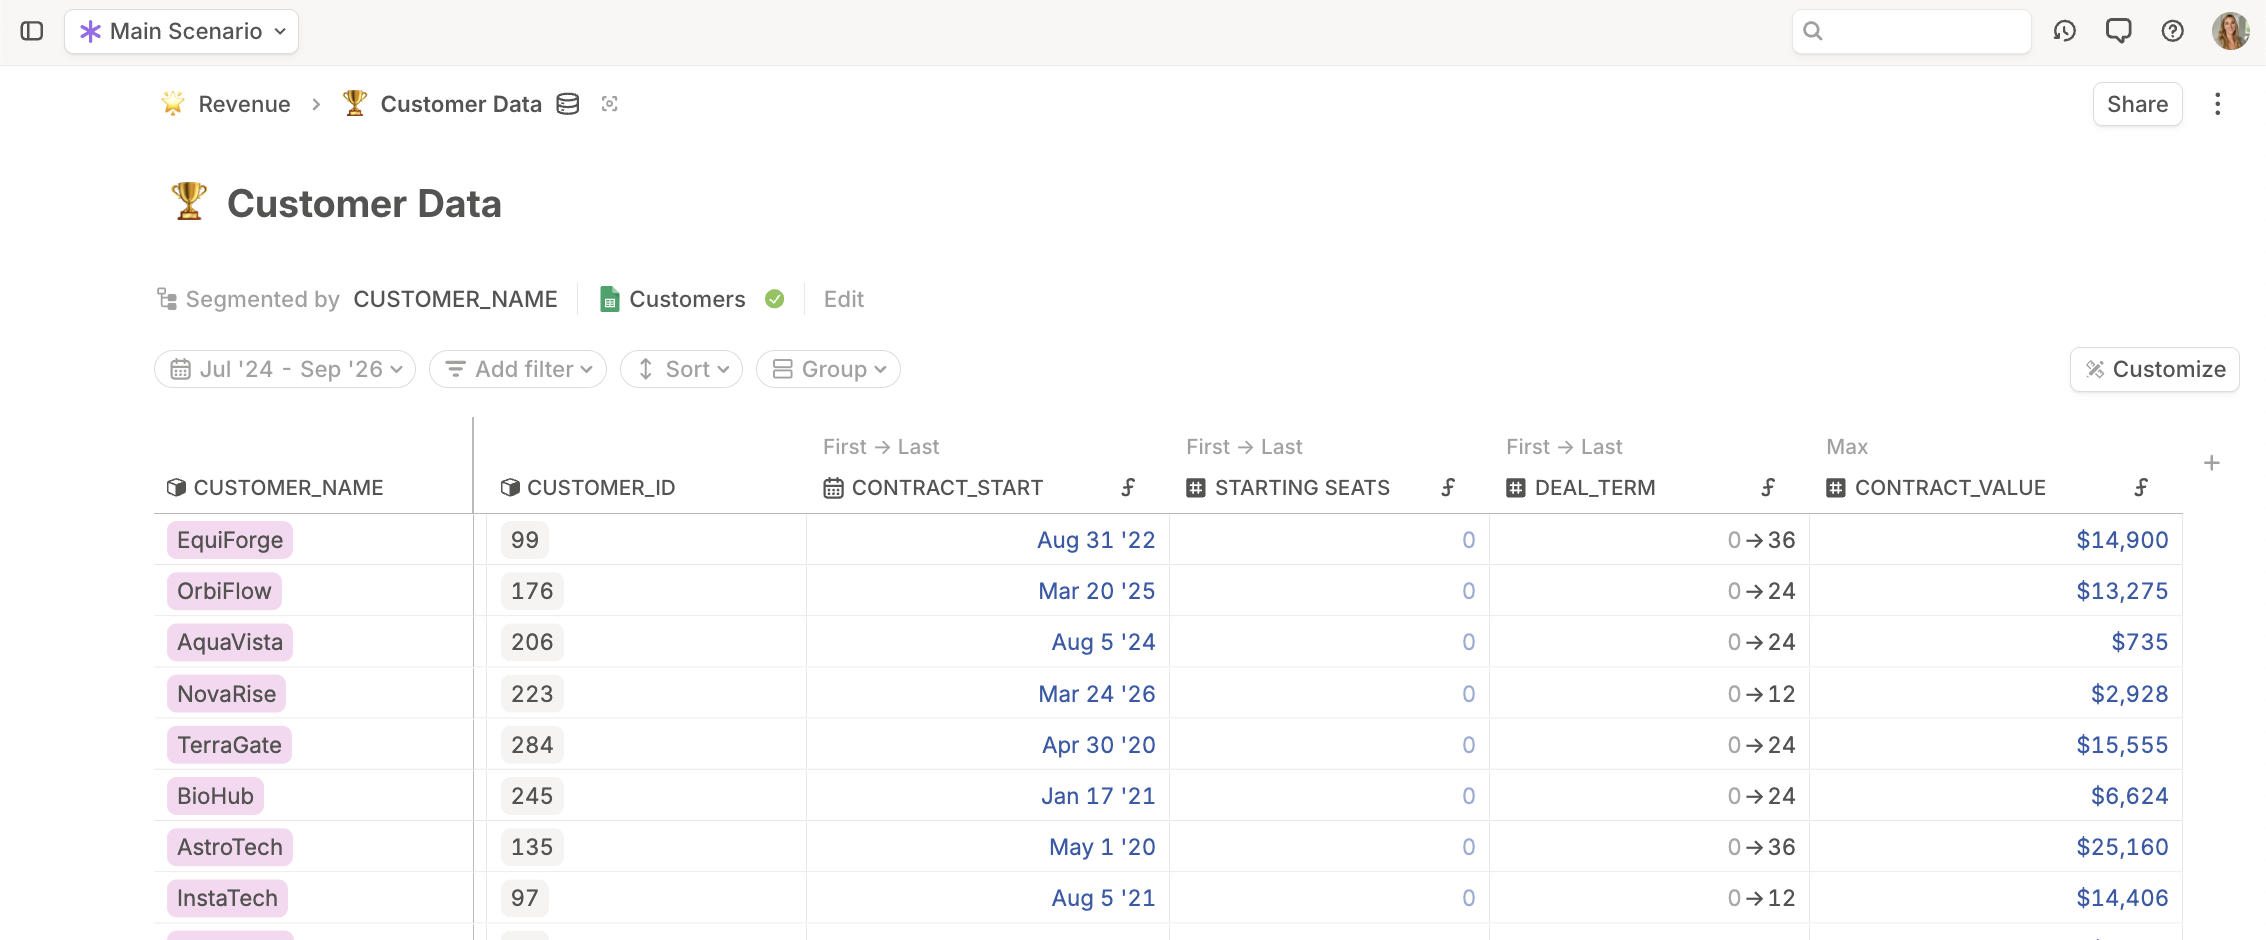
Create a dynamic ranking system that automatically updates as your data changes. Add the rank driver:- Navigate to your database
- Add a number driver column by clicking + and selecting number driver
- Name this driver Rank (or ARR Rank, Contract Value Rank, etc.)
- Click on the driver column name and select Add Default Formula
- Type
COUNT()to use the count function - Begin typing your database name to surface the database reference
- Choose the database column reference option (not the direct driver reference)
- Click the database pill to open formula editor options
- Click + Add Rule to add the ranking filter
- Set [Metric Column]
is greater than[Metric Column] This Segment - For example: ARR
is greater thanARR This Segment- This counts how many rows have a higher value than the current row
- Add + 1 to the end of the formula to convert to standard ranking format. This makes your top rank #1, rather than #0. Complete formula example:
COUNT([Database Name].[Metric Column]) + 1
Where the COUNT function has the “greater than This Segment” filter applied.
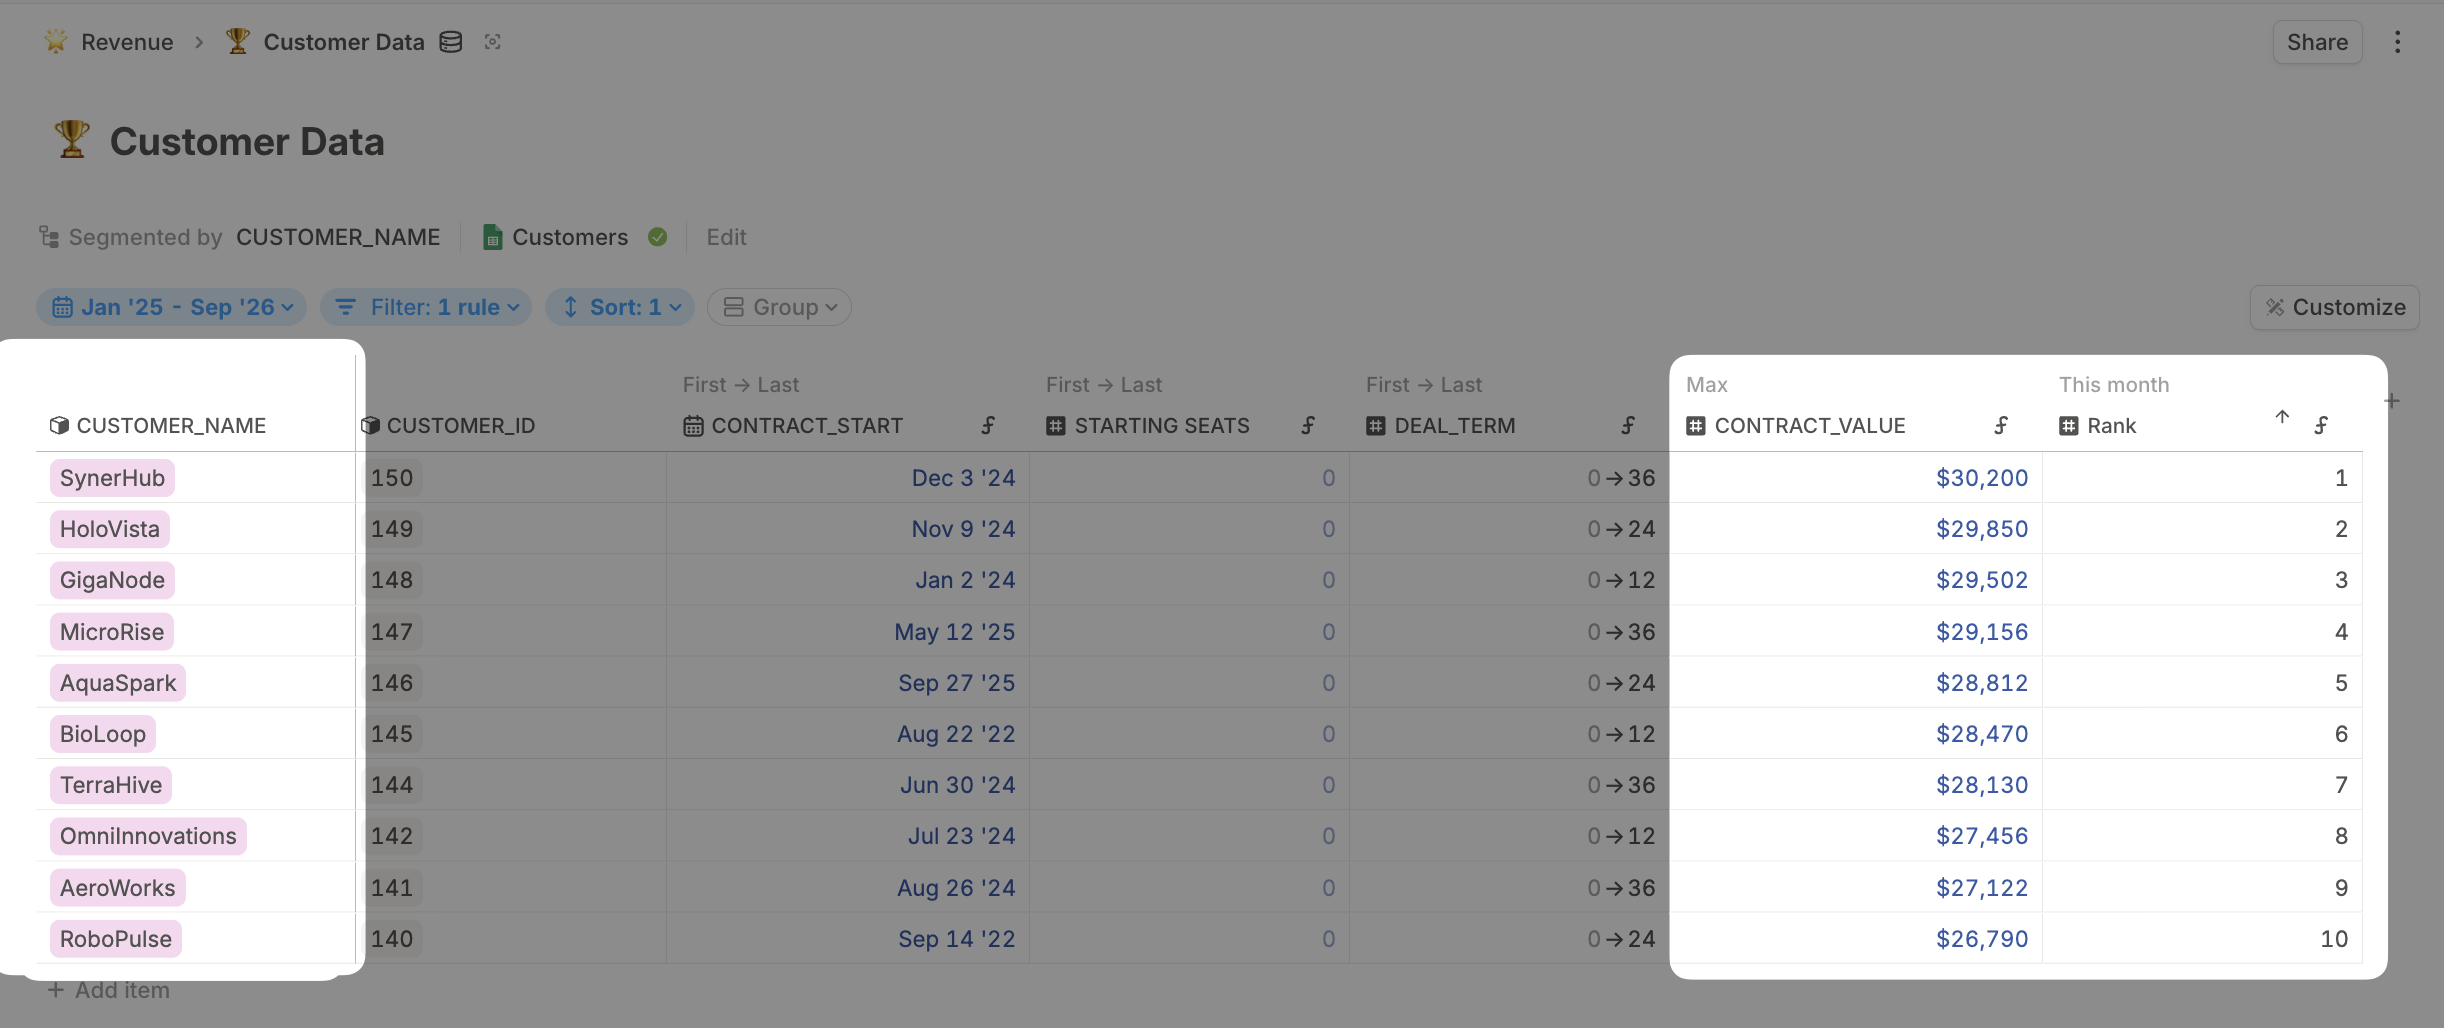
Step 3: Validate your rankings
Verify that your ranking system is working correctly. Check the results:- Your highest value record should show Rank = 1
- Your second highest should show Rank = 2
- Rankings should be consecutive (1, 2, 3, 4…) unless there are ties
- Click the column header of your ranking metric (ARR, Contract Value, etc.)
- Select Sort Descending to show highest values first
- Verify that Rank 1 corresponds to your highest value
Step 4: Using Rank throughout your workspace
Filter for top performers in database view or database block
Apply filters directly in your database to focus on top performers. Filter the database view:- In your database, click + Add Filter
- Select your Rank driver
- Set the condition to
is less than or equal toand enter your desired number- For top 10 customers: Rank
is less than or equal to10 - For top 5 vendors: Rank
is less than or equal to5
- For top 10 customers: Rank
- Click the column header of your ranking metric (ARR, Contract Value, etc.)
- Select Sort Ascending to show highest rankings first
Reference ranked data in models and formulas
Use your top performers data to drive calculations in financial models. Sum top performer metrics:- In a model, create a driver like Top 10 Customer ARR
- Click into the forecast formula and type
sum() - Reference your database with appropriate filters:
- Database reference: Customer Database.ARR
- Add filter: Customer Database.Rank
is less than or equal to10
- Create percentage calculations showing what portion of revenue comes from top customers
- Example: Top 5 Customer % =
[Top 5 Customer ARR] ÷ [Total ARR]