- Preparing your budget (by locking scenarios).
- Setting up actuals using your
Last Close
date. - Creating a BvA comparison using tables and charts.
Step 1: Lock your budget
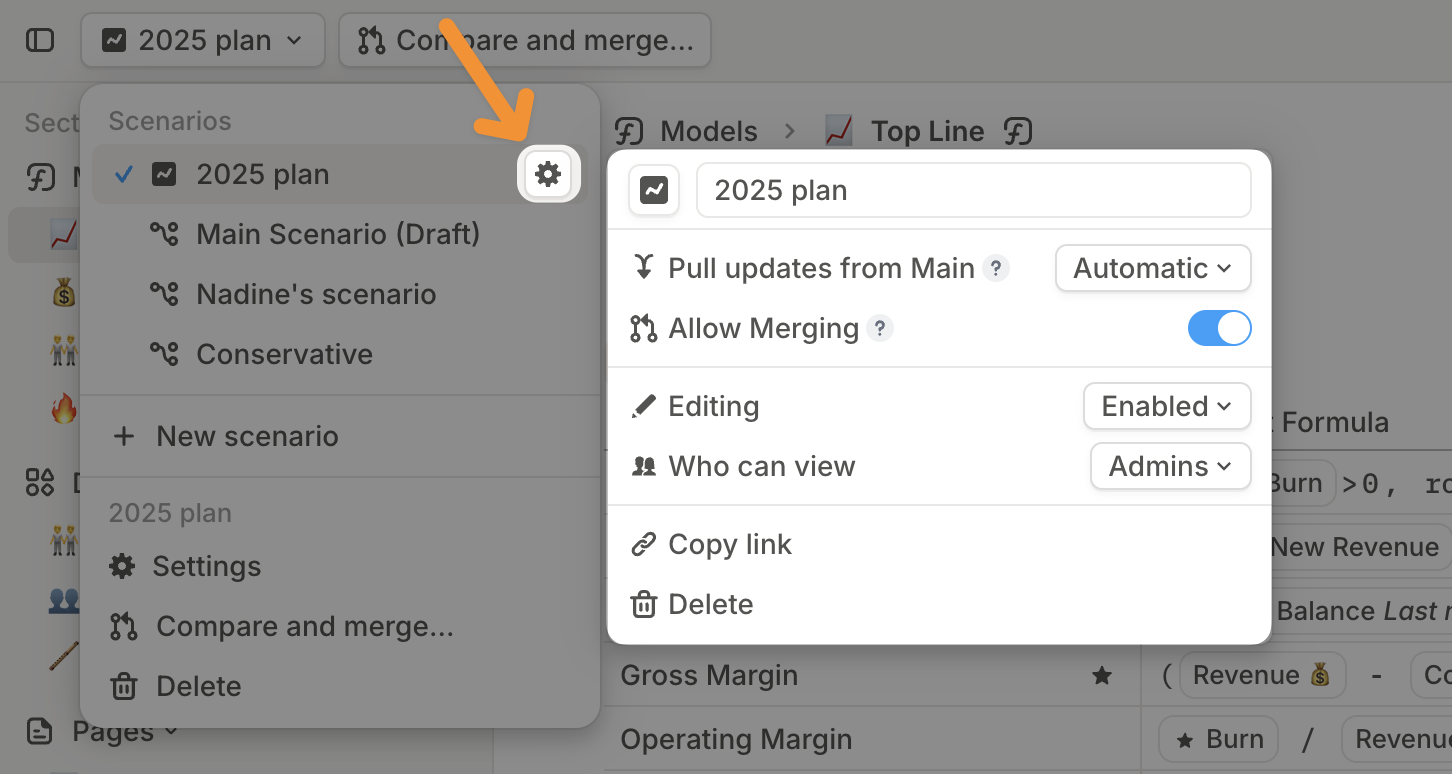
Your budget lives in scenarios—separate versions of your model representing different forecasts. Before tracking BvA, you need to lock your budget scenarios so they don’t change. To do this:- Disable auto-updates from main to unplug the scenario from the main scenario:
- In the scenarios list, click the Settings icon next to your scenario’s name.
- Disable
Pull updates from Main
. - This prevents changes from main scenario and integration syncs from affecting your budget.
- Prevent user edits for added security (optional):
- Set
Editing
toDisabled
in Scenario Settings. - This blocks accidental changes from your team.
- If changes are needed later, you can temporarily enable
Editing
, make adjustments, then disable editing again.
- Set

Step 2: Set up your actuals
Your planned budget now lives in a locked scenario, while actuals come from live data in your main scenario. To ensure that actuals reflect finalized numbers:- Open main scenario.
- Set
Last close
date to the end of the time period you’re analyzing.- For example: To compare budget vs. actuals for January–March, set
Last close
to March. - This tells Runway to pull actual values for closed months, while calculating future values using forecast formulas.
- For example: To compare budget vs. actuals for January–March, set

Step 3: Compare Budget vs. Actuals
You can analyze variances between budget and actuals using tables or charts.Option 1: Create a BvA table
- Open a model or create a
Driver table
in any page. - Add the drivers you want to include in your BvA.
- Click
Customize
(top right) → SelectCompare
→ Choose budget scenarios. - The default view shows time-series values for each scenario. You can add
Variance
andVariance %
to track the difference between budget and actuals. - You can also adjust the table layout to show scenarios as rows or columns.

- By default, if actuals exceed budget,
Variance
andVariance %
appear green. If actuals fall short, they’ll appear red. - To customize variance color right-click on a driver, click
Format and display
→Comparison color
and choose Positive variance is green or Positive variance is red - The Comparison color menu is only available when Comparison view is on for a driver table
- Typically for expenses, Positive variance is red (lesser values are better) and for income, Positive variance is green (greater values are better)

Option 2: Create a BvA chart
- Create a
Driver chart
in any page. - Add the relevant drivers.
- Click the
Compare
icon (top right) → Select budget scenarios to compare. - Choose a line or column chart to visualize trends.
